
Hotel stocks are in the vogue. In the past year, several have scaled record highs, with some more than doubling in value.
On a hot streak
Shareholders of hotels have earned significant gains over the last year
| Company | Market cap (Rs cr) | 1Y price return(%) |
|---|---|---|
| Benares Hotels | 1,158 | 169.5 |
| EIH | 26,187 | 149.7 |
| HLV | 1,545 | 133.8 |
| Chalet Hotels | 14,707 | 93.9 |
| Indian Hotels | 80,438 | 79.1 |
| Lemon Tree Hotels | 10,081 | 66.4 |
| Price data as of March 14, 2024 | ||
The rally was not pure euphoria either. Post-pandemic, the industry has been on a dream run. In FY22, the pent-up demand from the lockdown translated into soaring toplines. And in the last two financial years, the government's increased focus on tourism and infrastructure has kept the momentum alive.
Unsurprisingly, hotel stocks are frequently featuring in several hot stock lists. So, here's a Value Research crash course on how to analyse the hotel industry.
The nature of the beast
Before you consider investing in any industry, it's crucial to evaluate if its characteristics align with your investment philosophy and risk tolerance. For example, several investors might not have the stomach for high volatility and should refrain from investing in cyclical stocks.
Here are four traits of the hotel industry you must consider before investing.
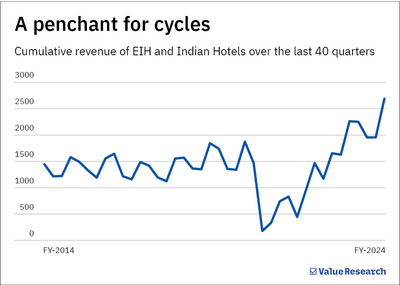
- It is highly cyclical. While all industries experience cycles, the hotel industry ranks particularly high in terms of cyclicity. First, demand is linked to seasonal factors; demand often peaks in the latter half of the year, driven by holidays and weddings. Also, economic ups and downs affect how much people travel, leading to noticeable shifts in hotel revenues.
- It is a capital-intensive industry. Setting up a hotel is an expensive affair. For example, Lemon Tree developed two new hotels in Shimla and Mumbai for Rs 1,006 crore back in FY22. So, inflated debt ratios are common in this industry. However, the high capital requirements work both as a boon and a bane. It provides entry barriers for new entrants while favouring larger, established players.
- Regulatory hurdles. The hotel industry in India faces several regulatory hurdles in the form of permits, zoning restrictions, safety regulations, etc. Consequently, projects are often delayed.
- High competitive intensity. The market is dominated by a few key players. According to a recent Horwath HTL report, the top 25 chains run about 90 per cent of hotels in the mid to luxury range. Success means standing out in this tight competition.
Its growth fuel
It is unwise to invest in any industry without understanding its growth drivers. Although each company has its unique factors for growth, hotel operators benefit from certain broad factors.
- Higher disposable income. Tourism drives demand for the hotel industry. The recent impressive financials of hotel operators can be linked to India's record-high air traffic in 2023. However, spending on travel is discretionary spending. Therefore, the hotel industry thrives during economic booms when there's higher disposable income.
- Food and beverages. The food and beverages segment is a key revenue generator for most hotel operators. Remarkably, food and beverages account for nearly 36 per cent of EIH's total revenue. Hence, establishing exclusive dining brands has proven to boost revenue growth considerably.
- Asset-light models. The hotel industry's capital-intensive nature means that business models reducing capital needs offer a competitive advantage. Recently, the asset-light management model, where operators manage hotels without owning the physical assets, has become popular. The Indian Hotels Company exemplifies this trend, generating Rs 391 crore in revenue from its management segment in the nine months ending December 2023. Impressively, this segment's EBITDA margin surpassed 35 per cent, outperforming the company's overall margin of 28 per cent by seven percentage points.
The metrics
The hotel industry relies on specific metrics to assess financial performance, each offering insights into different aspects of operations. Here's an overview of the common metrics used:
-
Occupancy Rate:
This metric measures the percentage of rooms occupied over a certain period, calculated by dividing the total number of occupied rooms by the total available rooms. A higher occupancy rate indicates greater demand and efficient use of assets.
- Average Daily Rate (ADR): ADR reflects the average revenue earned from an occupied room per day. It's calculated by dividing the total room revenue (revenue from rooms and associated services) by the number of occupied rooms. This metric helps in understanding pricing strategies.
- Revenue per Available Room (RevPAR): RevPAR combines the effects of occupancy and ADR, providing a comprehensive view. It's calculated by dividing total room revenue by the total number of available rooms. This metric is crucial for evaluating overall financial performance, including the impact of unoccupied rooms.
Here's a comparative study of major hotel operators based on the above metrics.
Comparing hotels
Essential numbers for analysing hotels
| Company | Occupancy rate (%) | Average daily rate (Rs) | RevPar (Rs) |
|---|---|---|---|
| Indian Hotels* | 72 | 12,550 | 9,050 |
| EIH | 79 | 19,985 | 16,962 |
| Lemon Tree Hotels | 65.9 | 6,333 | 4,176 |
| Chalet Hotels | 71 | 10,974 | 7,838 |
| Juniper Hotels# | 74.8 | 10,140 | 7,588 |
| SAMHI Hotels | 74 | 9,374 | 6,933 |
| Apeejay Surrendra Park Hotels# | 93.3 | 6,059 | 5,653 |
|
*India business. Data as of Q3 FY24. #Taken from RHP as for H1FY24 |
|||
A word of caution
Our guide provides a broad overview of the hotel industry. It is, however, important to note that each hotel operator is unique. While this guide can help investors narrow down promising hotel stocks, it should not be the sole basis for investment decisions. Investors must do the due diligence before investing in any hotel company.
Also read: Why you should use Value Research Stock Ratings
Ask Value Research ![]()