
While most people are happy tracking their funds' returns and perhaps even the top holdings, others prefer a full-fledged statistical analysis. For this reason, we provide such numbers on our Value Research Online fund page and the fund screener .
For those unsure about what we're referring to, we're talking about statistical measures like mean returns, standard deviation, Sharpe ratio, Sortino ratio, beta, R-squared and alpha.
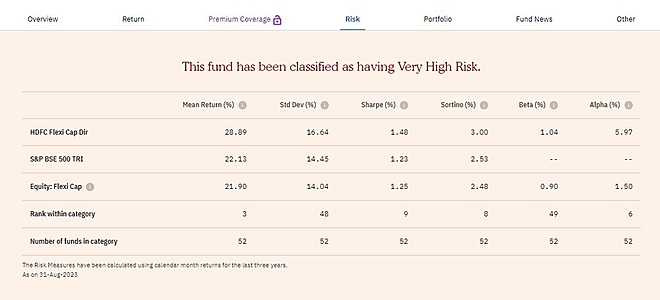
Key fund parameters for statistical analysis
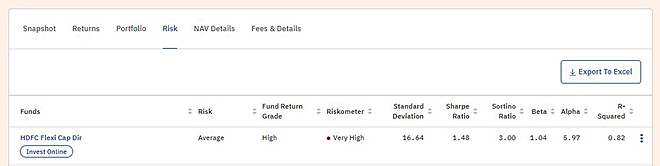
Fund screener to evaluate risk
Let's understand the meaning and concept behind these terms.
Mean return
It is the average of periodic returns of a fund, later annualised. We calculate it using monthly returns of the last three years.
Standard deviation
Standard deviation measures how much a fund's returns deviate from the mean returns. The lower the standard deviation, the less volatile and risky a fund is.
Let's assume there are two funds, A and B. Their monthly returns for the last six months are as follows:
| Fund A | Fund B | |
|---|---|---|
| Month 1 | 1.5 | 6 |
| Month 2 | 2 | -7 |
| Month 3 | -0.5 | 5 |
| Month 4 | 3 | -10 |
| Month 5 | -2 | 12 |
| Month 6 | 1.25 | -0.75 |
| Mean returns | 0.875 | 0.875 |
| Standard deviation (annualised) | 6.29 | 28.98 |
As you can see, both funds generate the same mean returns. However, a higher standard deviation indicates that Fund B is significantly more volatile and riskier.
Sharpe ratio
It is a measure of excess returns per unit of risk taken. Excess returns imply the returns a fund generates over and above the risk-free rate. Here, the standard deviation is a measure of risk.
Here is the formula for the Sharpe ratio:
Sharpe ratio = (Fund's return - Risk-free return) / Standard deviation of fund's return
Let's understand the numbers with an example:
| Fund C | Fund D | |
|---|---|---|
| Returns (per cent p.a) | 18 | 25 |
| Standard deviation (per cent p.a) | 15 | 30 |
| Risk-free rate (per cent p.a) | 3 | 3 |
| Excess returns | 15 | 22 |
| Sharpe ratio | 1 | 0.73 |
While Fund D delivered a 25 per cent return, it still underperformed compared to Fund C. In contrast to Fund D, Fund C has generated more returns for every unit of risk taken.
The takeaway is that the higher the Sharpe ratio, the greater the returns generated per unit of risk.
Sortino ratio
In terms of risk and volatility, an investor will be fine as long their wealth keeps growing. Only when it decreases do they become concerned. Simply put, people are thrilled when there is a bull run but don't care how much their investments go up as long as they move upwards.
Investors become nervous and uneasy whenever their money goes down, and the markets become bearish. It is safe to say that people associate the upside as fun and the downside as risky. Here is where the Sortino ratio comes in.
The formula for computing the Sortino ratio is-
Sortino ratio = (Fund's return - Risk-free rate) / Standard deviation of the downside
The Sortino ratio computes the returns per unit of downside risk. Here, the standard deviation can be calculated by taking a sample of instances where the returns are below a threshold. The threshold can be as per one's liking, such as a risk-free rate or a minimum return they prefer for their investments. We use instances of negative returns while calculating the Sortino ratio's standard deviation.
Hence, the higher the ratio, the better the returns per unit of downside risk.
Beta and R-squared
Beta and R-squared are two measures best understood together. A fund's beta measures its volatility concerning the market as a whole. The beta of the market/benchmark is 1.
For instance, a fund with a beta of 1.3 implies that if the markets go up by 10 per cent, the fund is likely to increase by 13 per cent. Similarly, if the market crashes by 10 per cent, the fund may lose 13 per cent. So, beta can infer whether the fund's returns will be more or less than the market returns.
The calculation of beta is done by referring to the appropriate benchmark. For instance, a beta of a large-cap fund w.r.t small-cap index is meaningless. Hence, using a suitable benchmark is essential. This is where R-squared comes in. It tests how reliable the beta is. R-squared can range from 0 to 1. The closer it is to 1, the more reliable the beta is.
For this reason, if you look at an index fund, you will find that its beta is 1, and R-squared is closest to 1, if not 1.
Alpha
Alpha measures the value added due to the fund manager's skill. It can be positive as well as negative. And no fund manager would want to have a negative alpha.
The formula for alpha is-
Alpha = Fund's returns - Expected returns
Expected returns = Risk-free return + Beta of the fund x (Market (benchmark) returns - Risk-free return)
Depending on the risk taken by the fund, expected returns are adjusted. A low-beta fund will have lower expected returns than a high-beta fund.
Let's understand this concept using an example:
| Small Cap Fund A | Small Cap Fund B | |
|---|---|---|
| Fund's returns (per cent p.a) | 35.5 | 28.6 |
| Risk-free returns (per cent p.a) | 3 | 3 |
| Beta | 1.6 | 0.85 |
| S&P BSE 250 Smallcap TRI (per cent p.a) | 23.5 | 23.5 |
| Expected returns (per cent p.a) | 35.8 | 20.43 |
| Alpha | -0.3 | 8.18 |
As you can see, higher returns don't always mean a higher alpha. Since Fund A was a high beta fund, its expected return was high, while the actual returns fell short of expected returns. And it was the exact opposite with Fund B.
Summing up
Now that you have a basic understanding of what each statistical measure means and how to interpret them, it is worth mentioning that all the figures on the fund page and fund screener are based on the monthly returns over the last three years.
Suggested read: P/E ratio and its importance
This article was originally published on September 13, 2023.
Ask Value Research ![]()