 Vinayak Pathak/AI-Generated Image
Summary: Not every diversified fund delivers what its label promises. A closer look at five ELSS and flexi-cap funds raises questions every investor should be asking.
Diversified equity funds work like a buffet. The fund manager can pick from the entire market (large, mid and small caps) and serve you a portfolio that reflects where the opportunity is best.
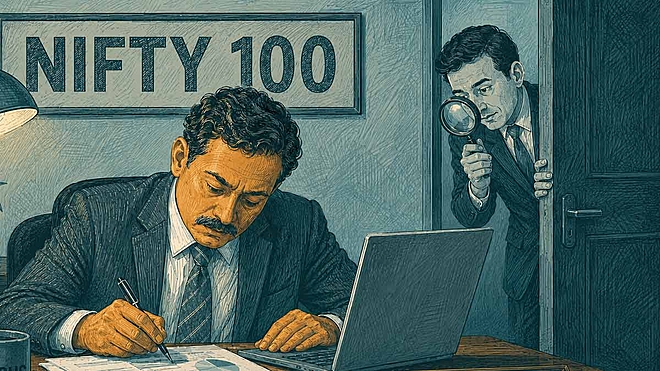
But some diversified funds are not running a buffet. They are serving the same dishes, in roughly the same proportions, as India's 100 largest companies. You ordered variety but got a fixed menu.
Currently, a handful of ELSS (equity-linked savings scheme) and flexi-cap funds have portfolios that look almost like the Nifty 100, the index of India's 100 largest companies, as per market capitalisation. More than half their holdings overlap with the index. Their assets under management (AUM) sit below the category median, which means size is not forcing their hand. And their three-year returns have either trailed or barely cleared the benchmark.
Are these funds playing safe? Or is size a problem? Let’s take a closer look.
Five funds, same problem
Portfolio overlap measures the weighted similarity between a fund's holdings and an index. A fund with a 60 per cent overlap with the Nifty 100 looks, in terms of what it owns, 60 per cent like that index.
Alpha measures how much a fund has outperformed its benchmark after adjusting for market risk. Negative alpha indicates a fund’s underperformance versus its benchmark.
Five funds in the ELSS and flexi-cap universe demonstrate these three characteristics: a Nifty 100 overlap of more than 50 per cent, AUM below the category median and a three-year alpha slightly greater than zero or negative.
Mimicking the benchmark
The five diversified funds that look like their index
| Fund | Category | Overlap with Nifty 100 (%) | AUM (Rs cr) | Three-year alpha (%) |
|---|---|---|---|---|
| Groww ELSS Tax Saver Fund | ELSS | 61.3 | 45.7 | -1.1 |
| UTI Children's Equity Fund | Flexi-cap | 53.8 | 1,010.10 | -1.6 |
| Mahindra Manulife ELSS Tax Saver | ELSS | 54.7 | 827.8 | -0.3 |
| Sundaram ELSS Tax Saver | ELSS | 54.2 | 1,183.40 | -0.2 |
| Sundaram Flexi Cap Fund | Flexi-cap | 53.8 | 1,825.60 | 0.2 |
| Data as of March 31, 2026 for direct plans. Alpha calculated over three years against each fund's category benchmark. Category median AUM is Rs 2,294.4 crore for ELSS and Rs 2,309 crore for flexi-cap funds. | ||||
The table above shows that four of the five funds reported negative three-year alpha. UTI Children's Equity Fund trails its benchmark by the widest margin at -1.6 per cent. The two Sundaram funds and Mahindra Manulife ELSS sit close to flat but still on the wrong side of zero, or only just above it. Sundaram Flexi Cap is the lone fund in positive territory, at 0.2 per cent.
Groww ELSS Tax Saver is the sharpest case: a 61.3 per cent overlap with the Nifty 100, -1.1 per cent alpha and an AUM of Rs 45.7 crore. It is small enough that most investors would not notice it, but the numbers make the point clear.
Size is not the excuse here
Actively managed funds with a large AUM often drift toward large-cap indices. Once a fund grows past a certain size, regulatory limits on single-stock exposure combine with the limited liquidity of mid- and small-cap stocks to force most of the portfolio into the biggest names. The manager ends up holding Nifty 100 stocks by necessity, not by choice.
That argument does not apply to these five funds. Each one sits below its category median in AUM. A flexi-cap fund with an asset base of Rs 1,000 crore has plenty of room to take meaningful positions in mid and small caps without running into liquidity problems. The large-cap clustering here is a portfolio decision. The manager chose this.
That distinction matters. A large fund that mirrors the index is at least structurally constrained. A smaller fund that mirrors the index is making an active bet that the index is where the returns are, and then charging an active management fee on top of it.
What you are giving up
When a diversified fund stays close to the large-cap index, two things tend to follow.
First, the fund will move broadly in line with large caps. And second, it will miss the upside when mid and small caps lead a cycle, which they do, sometimes sharply.
That is a real trade-off. The diversification benefit in a flexi-cap or ELSS allocation comes from those other segments contributing in their good years. A portfolio clustered in the top 100 stocks does not give you that.
When the same funds also fail to beat their benchmark over three years, the case for paying active fees in these specific funds becomes difficult to make. A Nifty 100 index fund, or an ELSS index fund for tax-saving, would have delivered a similar exposure with a lower expense ratio.
The category is not the problem
Both ELSS and flexi caps include funds that have generated strong alpha and run genuinely diversified portfolios. The issue is not the category. It is that the category label tells you nothing about what is inside.
Two questions are worth asking of any actively managed diversified fund before you put money in: Does the portfolio look meaningfully different from the index it is benchmarked against? And, has the fund cleared that benchmark over a reasonable period?
Where both answers are no, fresh allocation deserves more scrutiny than the category name alone provides.
Is your diversified fund also imitating its benchmark?
Subcribe to Value Research Fund Advisor to find out what your funds actually hold and how their returns compare to the index, so the gap between label and reality stays visible.
Ask Value Research ![]()