




 Sakshi/AI-Generated Image
Summary: The Nifty 50 and Nifty Next 50 both carry the ‘large-cap’ label but differ sharply in sector mix. This story breaks down the ‘graduation queue’ mechanism and the risks that come with that domestic tilt.
When someone says ‘large-cap index’, most investors picture one thing: the Nifty 50. The 50 biggest companies on the exchange, the number that scrolls across every news ticker, the benchmark every fund manager is measured against. It is the default index for passive investing in India, and it earns that status.
But a second large-cap index sits right next to it, rarely discussed and often misunderstood. The Nifty Next 50 holds companies ranked 51 to 100 by market capitalisation, the ones just outside the Nifty 50, large enough to be institutional-grade but still growing fast enough to move differently. Both indices carry a large-cap label. And over the past two decades, they have done meaningfully different things for investors who owned them.
Same market, distinct insides
The first thing to know about these two indices is that they are not mirror images of each other. They share a universe but not a composition.
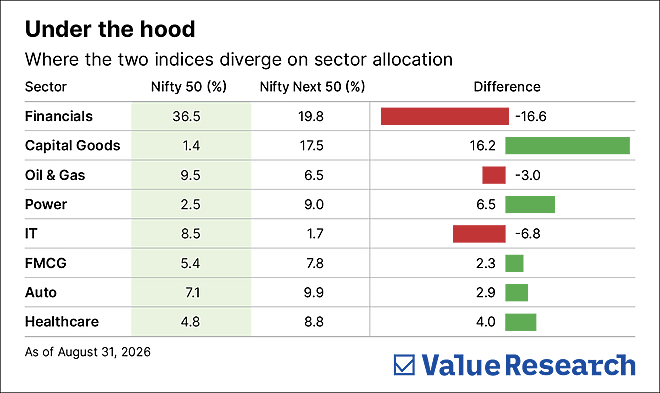
Financials account for 36.5 per cent of the Nifty 50. In the Nifty Next 50, that number falls to 19.8 per cent. Information technology is 8.5 per cent of the Nifty 50 and only 1.7 per cent in the Nifty Next 50. Oil and Gas is 9.5 per cent in the Nifty 50 versus 6.5 per cent in the Nifty Next 50.
Flip to the other side. Capital Goods is 17.5 per cent of the Nifty Next 50 and just 1.4 per cent of the Nifty 50. Power is 9 per cent in the Nifty Next 50 versus 2.5 per cent in the Nifty 50. FMCG, Chemicals, Realty and Metals are all more prominent in the Nifty Next 50 than in the Nifty 50.
These are not small differences in portfolio weightings. They are structural differences in what the two indices actually represent. The Nifty 50 is heavily anchored by Financials, IT, and Oil and Gas, sectors driven by global capital flows, interest rate cycles, and commodity prices. The Nifty Next 50 is anchored by Capital Goods and Power, sectors driven by domestic government spending, infrastructure execution, and India’s internal economic momentum.
In 2026, when global headwinds are weighing on IT and Financials, the Nifty 50 is down 10 per cent to date, while the Nifty Next 50 is up 4 per cent.
What two decades of data show
The structural difference in composition produces a measurable difference in outcomes over long periods. Looking at daily five-year rolling returns from January 2005 to September 2026, the Nifty Next 50 has delivered a median annualised return of 14.5 per cent. The Nifty 50 has delivered 13 per cent. A gap of 1.5 percentage points annually, sustained across nearly two decades and through multiple market cycles.

The Nifty Next 50 has outperformed the Nifty 50 in 74 per cent of all daily five-year rolling periods since 2005. In only 26 per cent of periods did the Nifty 50 come out ahead. The median outperformance when the Nifty Next 50 led was 3.4 percentage points per year, a meaningful compounding advantage.
The trade-off is volatility. The Nifty Next 50’s five-year rolling returns show a standard deviation of 6.1 per cent versus 4.8 per cent for the Nifty 50. The ride is bumpier. But the worst outcome for the Nifty 50 has been -1 per cent per year, and for the Nifty Next 50, 0.3 per cent per year.
The graduation queue
Another dimension of the Nifty Next 50 that return data alone does not capture is the graduation queue.
Every time a company grows enough in market capitalisation to displace one of the Nifty 50’s existing members, it graduates from the Nifty Next 50 into the Nifty 50. Nifty Next 50 investors hold these companies as they approach that inflexion point, when growth rates are still high, earnings are compounding fast, and the market has not yet fully re-rated them to the premium valuation Nifty 50 membership typically commands.
This graduation mechanism does not guarantee outperformance. Not every Nifty Next 50 company makes it in. Some plateau. Some stumble. The index also periodically includes companies that were recently demoted from the Nifty 50, businesses in decline, not in ascent.
But the index ensures that as the winners grow and earn their promotion, the investor has already been holding them, automatically.
The risks to hold alongside the opportunity
The same sector composition that gives the Nifty Next 50 its return advantage also gives it its specific risk profile. Capital Goods and Power companies are deeply tied to government spending cycles. When public capex slows, as it has during periods of fiscal consolidation, these sectors can lag significantly. The Nifty Next 50 is not a defensive index. It is a domestically oriented, growth-sensitive one.
Two indices, one decision
The Nifty 50 and the Nifty Next 50 are not substitutes for each other. They are distinct portfolio positions that behave differently because they are built differently.
The Nifty 50 gives the most liquid, most globally connected, most widely held businesses in India, a dependable anchor.
The Nifty Next 50 gives the domestic growth engine: companies more sensitive to India’s internal momentum, earlier in their compounding curve, with a structural track record of outperforming over long periods.
This article was originally published on October 01, 2026.
Ask Value Research 













 New Process Alert
  Seems like you've uploaded a wrong QR code. Please upload the QR code downloaded from MF Central platform.


