




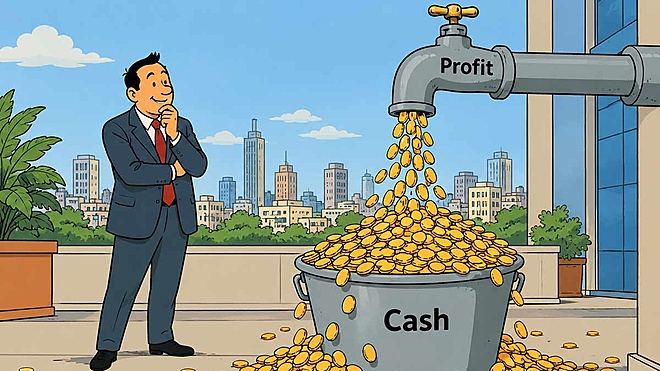
 Anand Kumar/AI-Generated Image

Summary: Two companies can report the same profit and end up in very different places. One funds its own growth. The other keeps going back to lenders. A single ratio is meant to tell them apart, so we screened for the highest readings we could find. What sat behind those numbers was not what we expected.
Profits matter, but businesses run on cash. A company can report rising profits and still need external funding if customers pay slowly, inventory piles up, or growth eats cash. Another may report similar profits but collect quickly, needing little extra working capital, a difference that matters to shareholders: reliable cash conversion gives a business more room to fund expansion, cut debt, pay dividends or acquire, without repeatedly raising capital. That is why we looked at the cash conversion ratio.
Cash conversion ratio = CFO ÷ EBITDA
EBITDA measures operating earnings before non-cash and financing costs; CFO shows how much cash operations actually generated. A ratio of 100 per cent broadly means Rs 100 of EBITDA generated Rs 100 of operating cash; sustained conversion above that can point to favourable working-capital economics, customer advances, or low dependence on receivables and inventory.
But does a higher ratio mean a better business? We ran a screen to find out.
How we screened
We looked for companies with market capitalisation above Rs 5,000 crore and an average CFO-to-EBITDA ratio above 120 per cent over five years to FY26, a deliberately high hurdle meant to find unusually strong cash generation relative to reported earnings, so we could examine why.
We also removed obvious distortions: PC Jeweller had negative EBITDA in some years and negative CFO in three of five, dividing two negatives, or cash flow by near-zero EBITDA, can produce a high ratio that says little about quality. Vedanta was excluded after validation showed its EBITDA series wasn't comparable with consolidated, post-demerger financials.
The five largest:
| Company | Market cap (Rs cr) | 5Y avg CFO/EBITDA |
|---|---|---|
| InterGlobe Aviation | 1,92,328 | 139% |
| DLF | 1,59,311 | 144% |
| Bharat Dynamics | 43,639 | 120% |
| Sobha | 13,020 | 136% |
| SG Mart | 9,468 | 367% |
At first glance these look impressive. Three companies show why the reason behind high conversion matters more than the ratio.
InterGlobe Aviation: when strong conversion is built into the business
InterGlobe Aviation, which operates IndiGo, shows what investors generally hope to uncover with this ratio. Passengers usually pay for tickets immediately, even weeks before flying, so the airline gets cash before providing the service or recognising revenue.
At March 2026, IndiGo had around Rs 6,024 crore of forward sales, tickets already sold for future journeys, against trade receivables of only about Rs 600 crore. Customers effectively fund the company in advance, explaining why operating cash flow has regularly run high relative to EBITDA, a feature of the business model, not a temporary working-capital release.
Even this needs a qualification: airlines run large leased fleets, and lease-liability repayments sit under financing, not CFO, so CFO captures upfront customer cash but not all the cash the fleet requires.
The first lesson: a high conversion ratio can reveal genuinely attractive working-capital economics, but CFO does not necessarily equal cash available to shareholders.
Bharat Dynamics: when the average hides the volatility
Bharat Dynamics reaches a similar five-year ratio by a far more uneven route: the defence manufacturer receives advances against contracts, adjusted as missiles and equipment are built and delivered, so customers partly finance execution. Contract liabilities stood at around Rs 6,252 crore at March 2026, against Rs 5,180 crore a year earlier.
But defence contracts are large, project-based and milestone-driven, so cash flows swing sharply year to year:
| Financial year | CFO (Rs cr) | CFO/EBITDA |
|---|---|---|
| FY26 | 604 | 93% |
| FY25 | 167 | 20% |
| FY24 | 412 | 46% |
| FY23 | 2,130 | 378% |
| FY22 | 530 | 63% |
The five-year average works out to about 120 per cent, yet no single year looks like a stable 120 per cent business; one extraordinary FY23 pulls the average up.
The second lesson: a good long-term average does not mean consistently good conversion. For businesses built on large contracts or milestones, individual years matter more.
SG Mart: when the ratio itself misleads
SG Mart produces the most dramatic result: its five-year average CFO-to-EBITDA ratio is an extraordinary 367 per cent, which alone would suggest the strongest cash generator in the group. The annual numbers tell a different story.
| Financial year | EBITDA (Rs cr) | CFO (Rs cr) | CFO/EBITDA |
|---|---|---|---|
| FY26 | 205.8 | 258.1 | 125% |
| FY25 | 183.3 | -391 | -213% |
| FY24 | 93.5 | -13.9 | -15% |
| FY23 | 0.27 | 4.39 | 1626% |
| FY22 | 0.41 | 1.27 | 310% |
The spectacular average comes largely from EBITDA being almost negligible in FY22-23, so even a few crore of CFO divided by under Rs 1 crore of EBITDA produces an enormous ratio. There's another problem: SG Mart was previously Kintech Renewables, and a change in control moved it into trading and manufacturing building materials, so recent operations bear little resemblance to earlier financials. CFO was negative in FY24-25 before turning positive in FY26.
The third and biggest lesson: a formula sees numbers, not whether the business has changed. SG Mart's 367 per cent is far less informative than the headline suggests.
How should investors use this ratio?
This screen was never meant to identify five stocks to buy, it was designed to answer a more useful question: when cash conversion looks unusually strong, what is actually driving it?
Each answer differs: IndiGo's advantage is structural, Bharat Dynamics is volatile despite advances, and SG Mart's average is an artifact of a tiny base and a changed business.
Cash conversion, then, works best as an earnings-quality and business-model screen, not a standalone measure of quality. Worth weighing alongside it:
- Revenue and EBITDA growth: high conversion means more when the business is growing, not merely shrinking activity releasing cash.
- Year-wise conversion: shows whether the ratio is structurally strong or riding one exceptional year.
- Working-capital movements: receivables, inventory, payables and advances show where the cash comes from.
- Free cash flow: CFO can look strong even when heavy capex consumes most of it.
- Debt and financing: interest, repayments and leases absorb cash outside CFO.
- Business changes: acquisitions, demergers or a changed model can make historical ratios incomparable.
None of this makes the ratio less useful, only more useful when read correctly. A company that grows consistently while converting most earnings into cash, without leaning on working-capital releases or supplier financing, has genuinely attractive economics.
This article was originally published on September 24, 2026.
Ask Value Research 

 New episodes every Friday








 New Process Alert
  Seems like you've uploaded a wrong QR code. Please upload the QR code downloaded from MF Central platform.


