




 Anand Kumar/AI-Generated Image

↵
Summary: Half of Hero Motors makes gears for electric bikes and its margins have climbed into the mid-teens. The other half makes stands, guards and swing arms, and it slipped into a loss last year. The IPO asks you to pay for the first half. The question is what the second half does to that maths.
Hero Motors' Rs 1,000 crore initial public offering (IPO) opens on September 16, 2026. It comprises a Rs 600 crore fresh issue and Rs 400 crore offer for sale. At the upper price band of Rs 84, the company is valued at about Rs 3,815 crore. Of the fresh issue, Rs 190 crore will repay debt, and Rs 200 crore will go towards expanding the ‘Powertrain’ capacity.
What the company does
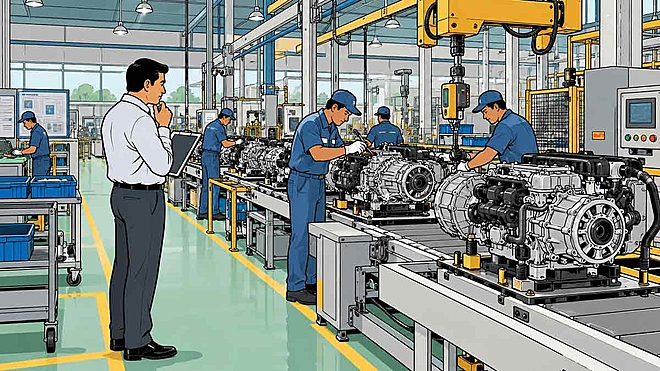
Hero Motors is an automotive component and powertrain supplier. Powertrain Solutions contributed 53.7 per cent of FY26 revenue. This division is further divided into two parts. Its Gears & Transmissions (G&T) division makes precision gears, gearboxes and transmission systems for motorcycles, cars, performance vehicles and EVs. Bike Powertrain serves e-bikes and other small electric vehicles with products such as continuously variable transmission (CVT) hubs, motors and electric drive systems.
The remaining 46.3 per cent came from Alloys & Metallics (A&M), which makes more conventional components such as chain cases, swing arms, stands, engine guards, cylinder blocks, suspension forks and handlebars. Hero served customers across 23 countries in FY26, while international customers contributed 41.4 per cent of revenue.
The EV transition is the real growth story
Hero's headline revenue growth does not immediately look exciting. Revenue increased at a two-year compound annual growth rate of only 5.7 per cent. The underlying mix tells a very different story.
| Revenue (Rs cr) | FY26 | FY25 | FY24 | 2Y CAGR (%) |
|---|---|---|---|---|
| EV | 273 | 176 | 128 | 46.1 |
| Non-EV | 915 | 914 | 936 | -1.1 |
| Total | 1,188 | 1,090 | 1,064 | 5.7 |
EV revenue grew 55.6 per cent in FY26 and now contributes 23 per cent of sales, up from just 12 per cent in FY24. Non-EV revenue, meanwhile, is lower than it was two years ago.
More strikingly, Hero added about Rs 99 crore of total revenue in FY26, while EV revenue itself added about Rs 98 crore. In other words, roughly 99 per cent of FY26 incremental revenue came from EV products.
Powertrain is improving; A&M is not
| Segment performance (Rs cr) | FY26 | FY25 | FY24 |
|---|---|---|---|
| G&T revenue | 488.9 | 452.7 | 418.1 |
| Bike Powertrain revenue | 148.9 | 81.5 | 102.2 |
| Powertrain revenue | 637.8 | 534.2 | 520.2 |
| Powertrain segment profit | 104.1 | 67.6 | 67 |
| Powertrain margin (%) | 16.3 | 12.6 | 12.9 |
| A&M revenue | 550.6 | 555.3 | 544.2 |
| A&M segment profit | -15.9 | 6.2 | 29.9 |
| A&M margin (%) | -2.9 | 1.1 | 5.5 |
Powertrain revenue rose 19.4 per cent in FY26 while segment profit jumped 54 per cent. EV-related G&T revenue has increased from about Rs 26 crore in FY24 to Rs 120 crore in FY26, while non-EV G&T declined from Rs 392 crore to Rs 369 crore. Bike Powertrain is now entirely EV-related.
A&M is the weak link. Revenue has barely moved while a Rs 30 crore FY24 profit became a Rs 16 crore loss. The RHP does not provide a detailed cost bridge, but flat production at the main sheet-metal plant, customer pricing pressure and underused capacity point to weak operating leverage, where fixed costs are spread over insufficient additional volume. Management plans to improve the mix through lightweight alloy products, premium motorcycles and higher-value forgings rather than abandon the segment.
Profit growth is stronger than revenue growth
| Key financials | 2Y CAGR (%) | FY26 | FY25 | FY24 |
|---|---|---|---|---|
| Revenue (Rs cr) | 5.7 | 1,188 | 1,090 | 1,064 |
| EBITDA (Rs cr) | 30.9 | 147.8 | 114 | 86.3 |
| Adjusted EBITDA (Rs cr) | 12.9 | 160.2 | 128.8 | 125.7 |
| PAT (Rs cr) | 55.5 | 41.2 | 32.8 | 17 |
| Total debt (Rs cr) | 14.8 | 400.8 | 407.6 | 304 |
Earnings before interest, tax, depreciation and amortisation (EBITDA) margin improved from 8.1 to 12.4 per cent, while profit after tax (PAT) more than doubled. However, share-based compensation fell from Rs 39.5 crore in FY24 to Rs 10.5 crore in FY26, helping reported profit growth.
Capacity tells two stories
The Rs 200 crore expansion targets the Gautam Buddha Nagar Powertrain plant, which was already operating at 88.3 per cent utilisation in FY26, supporting the need for additional gear-making capacity.
HYM and Spur are still ramping, but utilisation remains low. More concerning is Thailand, where utilisation fell from 12 per cent in FY24 to 3.9 per cent in FY26, while the UK operation also slipped to 24.2 per cent. Low utilisation hurts profitability because fixed costs such as salaries, maintenance, utilities and depreciation are spread over fewer units. This is visible in Thailand, which swung from a Rs 3.2 crore profit in FY25 to a Rs 6.7 crore loss in FY26. Hero’s fixed-asset turnover has also fallen from 2.40 times in FY24 to 1.83 times in FY26. Filling these facilities is therefore important for improving margins, asset efficiency and returns on capital.
Hero Motors IPO details
| Particulars | Details |
|---|---|
| Total IPO size (Rs cr) | 1,000 |
| Fresh issue (Rs cr) | 600 |
| Offer for sale (Rs cr) | 400 |
| Price band (Rs) | 79-84 |
| Subscription dates | September 16-18, 2026 |
| Purpose | Debt repayment, Powertrain expansion, acquisitions and general corporate purposes |
Post-IPO
| M-cap (Rs cr) | 3815.4 |
| Net worth (Rs cr) | 1081 |
| Promoter holding (%) | 61.6 |
| Price/earnings ratio (P/E) | 92.7 |
| Price/book ratio (P/B) | 3.5 |
| Key ratios | 3Y average | FY26 | FY25 | FY24 |
|---|---|---|---|---|
| ROE (%) | 6.9 | 8.6 | 7.7 | 4.5 |
| ROCE (%) | 20.6 | 19.8 | 18.8 | 23.2 |
| EBIT margin (%) | 5 | 6.3 | 5 | 3.6 |
| Debt-to-equity (times) | 0.87 | 0.83 | 0.96 | 0.81 |
| *ROCE uses adjusted EBITDA divided by average capital employed | ||||
What investors are paying for
| FY26 metrics | P/E (times) | P/B (times) |
|---|---|---|
| Hero Motors | 92.7 | 3.5 |
| CIE Automotive India | 16.1 | 1.86 |
| Endurance Technologies | 38.5 | 5.5 |
| Sona BLW Precision Forgings | 69 | 8.4 |
| Uno Minda | 57 | 10.2 |
| Varroc Engineering | 46.7 | 7.45 |
The peer median P/E is about 46.7 times. Hero therefore asks for a roughly 2x premium to the median despite having the lowest FY26 return on net worth in this peer set.
That premium is a bet that future Hero will look much better than historical Hero. It may: EV revenue is scaling quickly, Powertrain margins have reached the mid-teens and debt should fall after the IPO. But non-EV revenue is stagnant, A&M is loss-making, and several investments remain underutilised.
At around 93 times FY26 earnings, those outcomes are not merely upside. Much of it is already priced.
Also read: Purple Style Labs: Fewer customers, bigger losses
Ask Value Research 
 New episodes every Friday










 New Process Alert
  Seems like you've uploaded a wrong QR code. Please upload the QR code downloaded from MF Central platform.


