 Vinayak Pathak/AI-Generated Image
Summary: Gold has tumbled 22 per cent since the US-Iran War began, right when investors expected it to hold firm. So, is the ‘safe-haven’ tag still deserved?
Gold hit a new peak on January 29, 2026, delivering a 79 per cent return in just six months. Investor enthusiasm followed: gold ETF inflows that month reached an all-time high of Rs 24,039 crore, surpassing even equity inflows.
However, the glory was short-lived. As the US-Iran War broke out, gold fell alongside equities. By March 23, it had shed nearly 22 per cent from its peak, and that was the unsettling part. While the Nifty 50 fell around 10 per cent in the first three weeks of March, gold dropped 14 per cent over the same stretch. The supposed safe haven was moving in lockstep with equities.
Investors fled. Net inflows into gold ETFs collapsed 91 per cent in March 2026 to Rs 2,265 crore. But before writing gold off, it is worth asking: Has this kind of simultaneous fall happened before?
What history says
We looked at every period since 2006 when the Nifty 50 TRI fell 15 per cent or more from its peak, tracking both gold's overall return and its sharpest interim decline during each phase.
How has gold performed during equity drawdowns?
Though it mostly gave positive returns, interim declines have also been common
| Equity drawdown time period | Nifty 50 return (%) | Gold overall return in period(%) | Gold’s maximum decline during the period (%) |
|---|---|---|---|
| May '06 to Jun '06 | -29.7 | -14.9 | -18.3 |
| Feb '07 to Mar '07 | -15.2 | -0.2 | -2.9 |
| Jan '08 to Oct '08 | -59.5 | 5.2 | -18 |
| Nov '10 to Dec '11 | -27.2 | 13.7 | -11.9 |
| Mar '15 to Feb '16 | -21.7 | 9.9 | -11 |
| Jan '20 to Mar '20 | -38.3 | 2.6 | -10.3 |
| Oct '21 to Jun '22 | -16.4 | 8.1 | -6.1 |
| Sep '24 to Mar '25 | -15.4 | 14.1 | -7.7 |
| Jan '26 to Mar '26 | -15.1 | 8.9 | -22.5 |
| Periods when Nifty 50 TRI fell 15 per cent or more since 2006 are considered. ‘Gold’s maximum decline during the period’ refers to the largest fall in gold within that time frame, measured from the point when the equity drawdown began. | |||
The pattern is clear: gold has often ended equity downturns in positive territory, but the ride is rarely smooth. During the Global Financial Crisis, for instance, gold ultimately gained 5.2 per cent over the complete period even as the Nifty 50 crashed 60 per cent — yet it still fell 18 per cent somewhere along the way.
The lesson: gold's role as a cushion is best judged over the full duration of a downturn, not day by day. As Devender Singhal of Kotak Mutual Fund puts it, "Over shorter periods, correlations can turn positive and assets can move together. What matters is that over a longer period, the correlation tends to be low or sometimes negative. That is where diversification benefits come in."
If gold tends to hold up during equity downturns, does that automatically make it an ultimate safe haven?
Gold's safe-haven promise: Does it hold?
Not always.
To understand this better, we examined periods since 2006, when gold fell at least 15 per cent from its peak. We identified six such instances and checked how equities behaved during those same phases.
When gold stumbles, equities hold steady
In most cases, the Nifty 50 remained stable
| Period | Gold (%) | Nifty 50 (%) |
|---|---|---|
| May '06 to Aug '07 | -18.7 | 16.4 |
| Mar '08 to Aug '08 | -18 | 1.6 |
| Oct '08 to Nov '08 | -17.1 | -11.8 |
| Aug '11 to Aug '15 | -32.6 | 81 |
| Aug '20 to Mar '21 | -20.9 | 31.1 |
| Jan '26 to Mar '26 | -22.5 | -9.6 |
| Periods since 2006 when gold fell 15 per cent or more from its peak have been considered. Nifty 50 returns are based on the Total Return Index (TRI). | ||
Barring two instances, equities posted strong returns while gold struggled. The starkest example: from August 2011 to August 2015, gold fell 32.6 per cent while the Nifty 50 delivered 81 per cent.
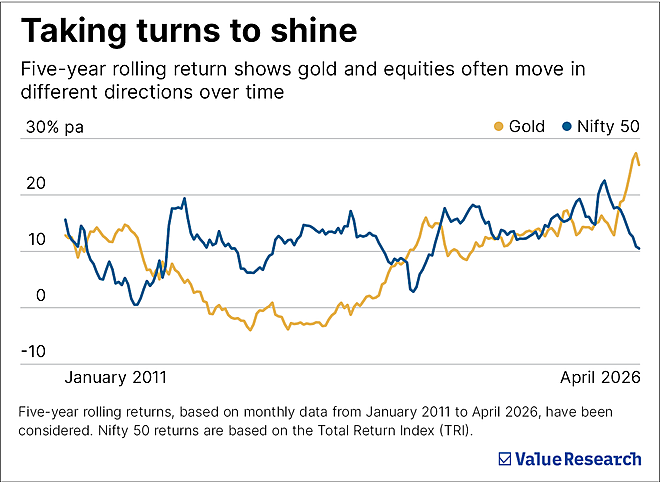
Together, both tables tell the same story: when one asset falls sharply, the other tends to hold up over the full period. Five-year rolling returns since January 2011 make this visible: strong equity runs frequently coincide with weaker gold, and vice versa.
The bottom line
Gold's recent decline looks dramatic but is not uncommon. What is unrealistic is expecting it to rise from the very first day of a market correction. It can and does fall during equity downturns, sometimes sharply. Calling it the ultimate safe haven overstates the case; it has its own extended phases of pain that sometimes last years.
The relationship is more reciprocal than hierarchical. Gold has supported portfolios during equity stress; equities have returned the favour when gold has struggled. Hold gold in moderation — 10 to 20 per cent of a portfolio is a reasonable range — keep expectations realistic and resist the urge to either panic-sell in a correction or overload after a rally.
Also watch: Why Gold Failed Its Biggest Test
Ask Value Research ![]()