Sakshi/AI-Generated Image
Summary: While both indices represent India’s top 100 companies, the Nifty Next 50 has historically delivered higher five-year returns than the Nifty 50, albeit with sharper drawdowns. The choice ultimately depends on your tolerance for volatility and investment horizon
Two indices, both made up of large-cap stocks and both drawn from India’s top 100 companies. Yet over time, they have delivered meaningfully different outcomes. Anyone building a core equity portfolio usually defaults to the Nifty 50. It is the headline index that represents India’s biggest, most liquid businesses that dominate their sectors. But just beneath it sits the Nifty Next 50 that contains companies ranked 51 to 100 by market capitalisation. These companies are also among India’s largest listed firms.
On the surface, the two indices look similar. But their returns, volatility and portfolio construction are different enough to merit a closer comparison.
Who wins over time?
Consider their long-term performance in the graph below. In the early years, both indices move broadly together. As markets rise and fall, they appear closely aligned. But a gap opens up gradually.
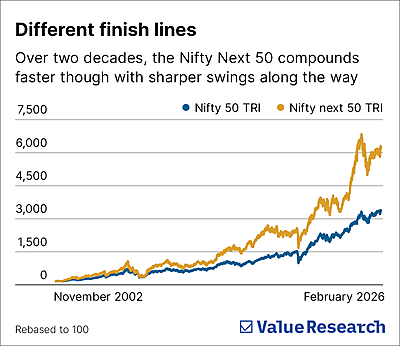
The Nifty 50 edges up steadily, reflecting established leaders growing at a measured pace. The Nifty Next 50 moves more unevenly, falls harder during stress and rebounds more sharply in recoveries. The ride is visibly bumpier. Yet over two decades, it climbs more steeply, becoming the clear winner but demanding greater tolerance along the way.
This pattern is not confined to one bull market. It persists across cycles, through the global financial crisis, liquidity tightening and the post-pandemic surge. The outperformance builds gradually over time.
Stripping out timing bias
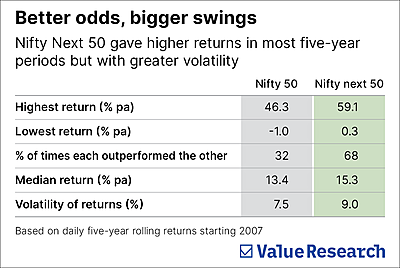
Simple price charts capture only the journey from a fixed starting point. A fairer way to judge performance is to examine daily rolling returns. So instead of asking what happened from one chosen date, we ask a more practical question: If you had invested on any day since 2002 and held for five years, what annual return would you have earned on average? The answer: 15.3 per cent for the Nifty Next 50 versus 13.4 per cent for the Nifty 50.
Over all five-year periods, the Next 50 also beat the Nifty 50 in 68 per cent of instances. More strikingly, it did not give a negative five-year return even once. Its worst five-year outcome was still marginally positive. The Nifty 50, at its weakest, slipped slightly below zero.
This is where the comparison becomes clearer. Investing is rarely about picking the single best year. It is about improving the odds over your actual holding period. On that count, history suggests the probability has tilted in favour of the Next 50, provided you stayed invested for at least five years.
What is driving the gap?
The explanation lies in what these indices own.
The Nifty 50 is heavily weighted towards Financial Services, alongside large Technology and Energy companies. These are mature, scaled franchises. They generate consistent profits. Their growth is steady, but often incremental. They already command dominant market positions.
The Nifty Next 50 has a different economic profile. Financials are present but less dominant. There is greater representation from Capital goods, Automobiles, Power, Metals and consumer-facing sectors. Many of these businesses are earlier in their growth trajectory. They are expanding capacity, gaining market share and benefiting from domestic investment cycles.
Think of it this way. The Nifty 50 largely holds incumbents. The Next 50 holds aspirants.
There is also a structural feature at play. When a company in the Next 50 grows large enough, it moves up into the Nifty 50. The index is then refreshed with the next rising firm. This built-in churn keeps the Next 50 tilted towards companies on the ascent rather than those already entrenched. Faster growth, however, rarely comes without greater swings.
The cost of higher returns
The same rolling-return data highlights the trade-off. The volatility (standard deviation) of five-year returns for the Next 50 stands higher at 9 per cent compared to 7.5 per cent for the Nifty 50. Peak-to-trough declines reflect this volatility even better. On average, the Nifty 50 has fallen about 5 per cent while the Next 50 has dropped closer to 9 per cent from their respective highs. At the lowest point since November 2002, the Nifty 50 fell 59 per cent from its peak. The Next 50 fell 72 per cent.
Deeper declines like these are not abstract. They test investor patience, create doubt and prompt untimely exits. The higher long-term returns of the Next 50 have historically been the reward for enduring that discomfort.
Which index should you own?
For investors, the takeaway is not that one index is superior in all circumstances. It is that they serve different roles within the same large-cap universe.
The Nifty 50 offers relative stability within equities. It represents scale, liquidity and established leadership. It may suit investors who prioritise smoother performance or who are closer to their financial goals.
The Nifty Next 50 offers exposure to the next rung of large Indian corporates. It has historically delivered higher long-term returns and a greater probability of stronger five-year outcomes, albeit with sharper interim declines.
Many investors may still benefit from blending the two, combining stability with growth potential. Younger investors with long-term horizons and steady income streams may lean more towards the Next 50. Those seeking to moderate volatility may tilt towards the Nifty 50.
Both offer exposure to India’s top 100 companies. What matters is whether you value growth or a sound sleep.
This article was originally published on March 01, 2026.
Ask Value Research ![]()