




 Ujjal Das/AI-Generated Image

Summary: The list of international funds open to fresh SIPs has been shrinking for months. This week it reached one. And the ETFs that remain accessible carry a hidden cost most investors never check before buying.
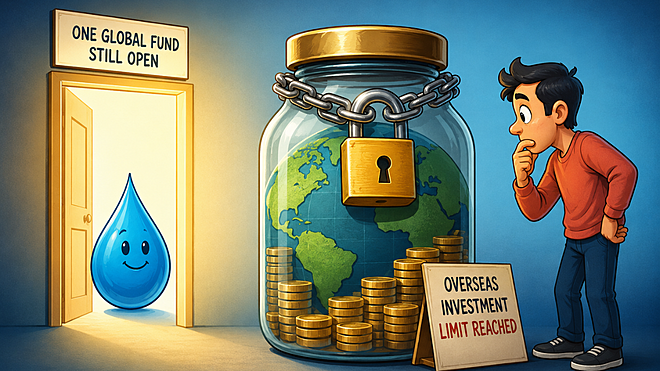
Every week we track which international funds are still open to fresh money. The list has shrunk for months, and this week it is down to one. If you want to start a SIP in a global fund today, your only choice is Baroda BNP Paribas Aqua. Every other fund we follow has shut to new SIPs because each has run into India’s limit on investing abroad. Existing SIPs continue. Starting a new one is the problem.
Only one fund still takes your money
| Fund / Invests in | Fresh SIP? | Lumpsum? | 1Y | 3Y | 5Y |
|---|---|---|---|---|---|
| Baroda BNP Paribas Aqua FoF Global water theme | Open | Yes | 22.7 | 14.4 | 10.2 |
| Returns are CAGR (per cent), direct plan, growth, as of July 15, 2026. FoF is a fund of funds, which invests in an overseas fund. | |||||
The limit that keeps shutting the doors
India caps how much its mutual funds can hold abroad: $7 billion in foreign securities across the industry, plus a separate $1 billion for overseas ETFs. The industry hit the main limit in January 2022, and SEBI froze every fund house at whatever it held abroad on February 1, 2022. A house can invest overseas only up to that frozen line, and as rising markets lift a house’s holdings back towards that line, the house must stop taking fresh money. That is what PGIM, Franklin and Edelweiss have each done in recent weeks.
An ETF’s ‘return’ can be just the premium
With the funds shut, ETFs are the main way left in. An ETF trades every day, so it never closes. An ETF has two prices: the market price it trades at on the exchange, and the NAV, the value of the holdings behind each unit. Normally the two track each other. But these funds hit their own $1 billion cap in April 2024 and can no longer create new units, so supply is stuck while demand is not. The market price floats above NAV, and that gap is the premium. An ETF can therefore climb for two reasons: because its holdings rose, or because the premium widened.
Take Mirae Asset Hang Seng TECH. Its holdings fell about 2 per cent over the year, yet buyers made about 6 per cent, so the whole gain came from a widening premium. Today the fund trades at Rs 22.99 against an NAV of Rs 19.54, about 18 per cent over what it actually holds. That is the extreme. For most of the others the market did the heavy lifting, and a rising premium padded the number on top.
What you earned versus what the fund earned over the past year
| ETF / Invests in |
Buyer's return (%)
|
Holdings' return (%) | Premium change (pts) | Premium: then → now (%) |
|---|---|---|---|---|
| Mirae Asset Hang Seng TECH Hong Kong tech | 6 | −2 | +9 | 9.0 → 17.6 |
| Motilal Oswal Nasdaq Q50 US Nasdaq next tier | 87 | 60 | +17 | 2.4 → 19.8 |
| Motilal Oswal NASDAQ 100 US tech-heavy index | 70 | 45 | +18 | 0.5 → 18.3 |
| Nippon India ETF Hang Seng BeES Hong Kong equity | 24 | 15 | +8 | −0.7 → 7.2 |
| Mirae Asset S&P 500 Top 50 US large-caps | 38 | 32 | +5 | 12.8 → 17.7 |
| Mirae Asset NYSE FANG+ US mega-cap tech | 31 | 33 | −2 | 19.0 → 16.8 |
| Buyer’s return is the change in NSE market price; holdings’ return is the change in NAV, in rupees; both over the year to July 15, 2026, rounded. Premium change is the shift in market price over NAV across the year. | ||||
The last row is the flip side. FANG+ returned about 31 per cent to buyers, just under the 33 per cent its holdings earned, because its premium slipped. A falling premium eats into your return even in a rising market. The two to watch are the Motilal Oswal Nasdaq funds: Q50 at about 20 per cent over NAV against a 52-week average near 12, and NASDAQ 100 at 18 against an average near 8. Both sit well above their norm. The other four trade below their own average. So do not read an ETF’s past year as a guide to your next. Before you buy, check the premium against NAV and against where the fund usually trades.
Where each ETF’s premium stands now
| ETF / Invests in | NAV (Rs) | Price (Rs) | Premium now (%) | 52-wk premium range (%) | 52-wk avg premium (%) | 52-wk avg daily t/o (Rs cr) |
|---|---|---|---|---|---|---|
| Motilal Oswal Nasdaq Q50 US Nasdaq next tier |
119.1 | 142.71 | 19.8 | −1.7 to 26.4 | 11.9 | 1.44 |
| Motilal Oswal NASDAQ 100 US tech-heavy index |
277.42 | 328.05 | 18.3 | −3.0 to 27.7 | 8.2 | 23.58 |
| Mirae Asset S&P 500 Top 50 US large-caps |
67.12 | 79.02 | 17.7 | 10.8 to 23.7 | 19.1 | 1.71 |
| Mirae Asset Hang Seng TECH Hong Kong tech |
19.54 | 22.99 | 17.6 | 8.8 to 36.4 | 19.1 | 2.81 |
| Mirae Asset NYSE FANG+ US mega-cap tech |
168.21 | 196.41 | 16.8 | 11.8 to 30.1 | 19.7 | 5.37 |
| Nippon India ETF Hang Seng BeES Hong Kong equity |
449.27 | 481.63 | 7.2 | −0.7 to 25.6 | 14.9 | 9.41 |
| NAV, price and ‘premium now’ are as of July 15, 2026. ‘52-wk avg premium’, the premium range, and average daily turnover cover the year to that date, NSE only. Premium is the market price over the fund’s underlying value (NAV); a negative figure is a discount. | ||||||
The global door has narrowed to one small fund, and the ETF route comes at a price. None of that changes why you want money abroad: your job, your home and your savings are already one big bet on India. The question is how much exposure to take, and how. That is what the Value Research Fund Advisor is built to answer.
If you hold an international fund or are eyeing an ETF, check its premium before you act.
Ask Value Research 

 New episodes every Friday










 New Process Alert
  Seems like you've uploaded a wrong QR code. Please upload the QR code downloaded from MF Central platform.


