




 Anand Kumar/AI-Generated Image

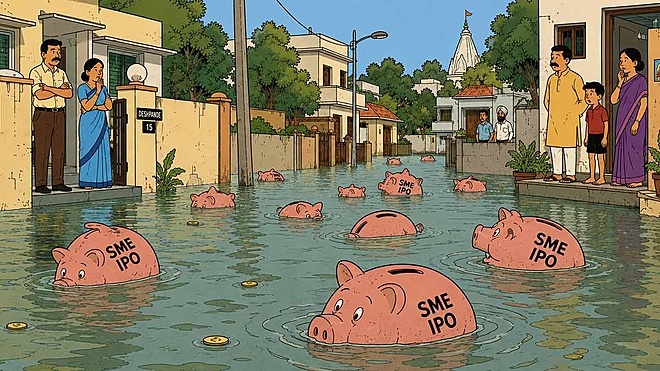
Summary: The rush for SME IPOs has only intensified in recent years. Before joining the queue, it's worth understanding what the numbers say about the odds of long-term success.
Of the 1,192 SME companies that have listed since 2016, 52 per cent trade below their issue price today.
That figure, the one most often quoted, is also the kindest possible way to tell the story, because it assumes you bought the shares at the issue price. But in a heavily oversubscribed SME IPO, almost nobody does.
Take NACDAC Infrastructure for instance. Its 2024 IPO was subscribed nearly 1,976 times, so the allotment was effectively a lottery, and as a result, most applicants got nothing. The company priced its shares at Rs 35. They opened at Rs 66.5, a 90 per cent jump, and now trade near Rs 26.
The allottee is down about a quarter. The listing-day buyer, which is what nearly every retail investor was, is down about 61 per cent. The issue price belongs to the lucky few. The listing price belongs to everyone else.
This story therefore measures SME IPOs from the listing price, the price an ordinary investor could actually pay.
The listing pop is the toll
The hotter the issue, the higher the toll charged for entry.
Across all SME IPOs since 2016, the typical debut jumped about 6 per cent and 73 per cent of issues opened above their issue price. Among the 202 companies where subscription figures are available, mostly recent listings, subscription levels closely tracked the size of the listing pop and showed almost no relationship with the returns investors earned after listing.
The IPOs investors who fought the hardest to enter turned out, on average, to be no better afterwards.
The allotment queue has lengthened dramatically. SEBI's own figures show applications per successful allottee climbing from four in 2021-22 to 46 the following year and then to 245 in 2023-24. At those odds, the issue price becomes a courtesy extended to a lucky few. The listing price is what the market charges everyone else.
The quiet compounders
Stocks that listed to silence and multiplied money anyway.
| Company | Listed | Debut pop (%) | Money multiplied (x) | A year (%) | Where now |
|---|---|---|---|---|---|
| City Pulse Multiventures | 2019 | -5 | 32 | 64 | SME board |
| Spectrum Electrical Industries | 2018 | 2.3 | 30 | 55 | Mainboard |
| Solex Energy | 2018 | -16.3 | 23 | 45 | Mainboard |
| NPST | 2021 | 4.9 | 19 | 82 | Mainboard |
| Shri Venkatesh Refineries | 2021 | 5 | 17 | 82 | SME board |
| Pansari Developers | 2016 | 0 | 16 | 33 | Mainboard |
| Rhetan TMT | 2022 | 0 | 14 | 99 | Mainboard |
| Laxmi Goldorna House | 2020 | 0 | 14 | 53 | Mainboard |
| Creative Newtech | 2017 | 1 | 12 | 31 | Mainboard |
| Megastar Foods | 2018 | 1.7 | 12 | 36 | Mainboard |
The loudest debuts
The 10 biggest listing-day pops ranged from 242 to 387 per cent. Eight now trade below their listing price and six have lost more than 60 per cent from it.
| Company | Listed | Debut pop (%) | Since listing (%) |
|---|---|---|---|
| Winsol Engineers | 2024 | 387 | -67% |
| Kay Cee Energy & Infra | 2024 | 367 | -64% |
| Maxposure | 2024 | 339 | -76% |
| Vivo Collaboration Solutions | 2021 | 333 | -78% |
| Medicamen Organics | 2024 | 305 | -84% |
| GP Eco Solutions India | 2024 | 299 | 16% |
| Divine Power Energy | 2024 | 288 | 274% |
| Purv Flexipack | 2024 | 266 | -82% |
| Esconet Technologies | 2024 | 245 | -58% |
| Goyal Salt | 2023 | 242 | -9% |
| Nine of the 10 listed in the froth of 2023-24. The buyer who paid the pop paid the toll. | |||
Re-anchor the numbers at the listing price and every headline worsens. The share of companies trading below their entry price rises from 52 per cent to 57 per cent. The median return falls from minus 6 per cent to minus 13 per cent. And 455 companies, more than a third of the entire universe, opened above issue and later fell below their listing price, a round trip the issue-price scoreboard never records.
The winners leave and the failures vanish
The usual SME statistics contain a second distortion. They count only companies still listed on SME boards. But SME boards are nurseries, not destinations.
Successful companies migrate to the main board and those graduates are disproportionately the winners. We tracked the 200 companies that made the jump and measured them from their SME debut. Their median return was plus 49 per cent and 43 per cent became multibaggers, compared with 17 per cent of companies that stayed behind.
Knowledge Marine listed near Rs 19 in 2021 and trades around Rs 2,400 today. Advait Energy and SBC Exports have each risen more than eightyfold.
A scoreboard drawn only from today's SME boards scores a race after the champions have already left the track.
The opposite happens at the other end.
When an SME collapses or becomes entangled in fraud allegations, it can disappear from the exchange altogether, leaving shareholders with stock they cannot sell. The 20 delisted companies in our sample have a median return of minus 82 per cent. Suumaya Corporation fell from around Rs 70 to roughly Re 1. Varanium Cloud dropped from Rs 30 to below Rs 6.
Since dead tickers disappear from databases first, 20 is probably an underestimate.
The wipeouts
The bottom 10 are all down by 90 per cent or more from their listing prices. Three had graduated to the main board before collapsing.
| Company | Listed | Since listing (%) | Price then vs now (Rs) | Where now |
|---|---|---|---|---|
| Suumaya Corporation | 2021 | -98.6 | 70 → 1.01 | Delisted |
| Omnipotent Industries | 2021 | -97.5 | 99 → 2.50 | SME board |
| Diksha Greens | 2018 | -97.1 | 36 → 1.04 | SME board |
| Akshar Spintex | 2018 | -95.9 | 10.12 → 0.42 | Mainboard |
| Jinaam's Dress | 2019 | -95.8 | 56 → 2.37 | Delisted |
| Powerful Technologies | 2018 | -95.7 | 45 → 1.95 | Delisted |
| Jalan Transolutions | 2017 | -95.6 | 42 → 1.85 | SME board |
| Suich Industries | 2019 | -93.9 | 71.35 → 4.33 | Delisted |
| SecUR Credentials | 2017 | -92.9 | 23 → 1.63 | Mainboard |
| Debock Industries | 2018 | -91.7 | 9.86 → 0.82 | Mainboard |
One table shows what happens when both migrations are counted.
| Universe counted | Companies | Median return from listing (%) | Below listing price (%) |
|---|---|---|---|
| Still listed on SME boards (the usual basis) | 972 | -15.2 | 59 |
| Adding the migrated winners | 1,172 | -11.8 | 56 |
| Adding the delisted failures | 992 | -15.8 | 59 |
| Full record, both included | 1,192 | -13 | 57 |
Migration flatters the survivors by removing the best. Delisting flatters them again by removing the worst. The full record contains both.
The average belongs to someone else
Across all 1,192 companies, 676 are below their listing price while only 516 are flat or higher.
Yet the average return across the universe is still plus 115 per cent.
A handful of names carry the entire figure.
The 10 biggest winners, less than one per cent of the sample, average roughly 6,000 per cent between them. Remove just the top tenth of performers and the average return flips to minus 2 per cent.
The average belongs to the jackpot names.
The median belongs to everybody else.
The jackpot 10
Eight of the 10 biggest winners debuted with a pop of 3 per cent or less. Nobody queued for them.
| Company | Listed | Debut pop (%) | Money multiplied (x) | A year (%) | Where now |
|---|---|---|---|---|---|
| Knowledge Marine & Engineering Works | 2021 | 2.7 | 128 | 149 | Mainboard |
| SBC Exports | 2019 | 0 | 86 | 88 | Mainboard |
| Advait Energy Transitions | 2020 | 1.9 | 84 | 115 | Mainboard |
| Sky Gold and Diamonds | 2018 | 0.2 | 69 | 72 | Mainboard |
| Gretex Corporate Services | 2021 | 1.2 | 52 | 123 | Mainboard |
| Kesar India | 2022 | 1.5 | 50 | 166 | SME board |
| KPI Green Energy | 2019 | 1 | 45 | 66 | Mainboard |
| Concord Control Systems | 2022 | 99.9 | 41 | 169 | SME board |
| D.P. Abhushan | 2017 | 20 | 35 | 50 | Mainboard |
| DJ Mediaprint & Logistics | 2020 | 3 | 33 | 75 | Mainboard |
| Money multiplied is calculated as the value of Re 1 invested at the adjusted listing price, at the latest price. Eight of the 10 have since graduated to the mainboard. | |||||
If anything, the lesson runs against IPO folklore. The market's biggest winners were rarely the names investors fought hardest to own.
The lesson is the same.
You did not need the lottery ticket to find the winners.
One vintage did most of the damage
Split the record by listing year and the losses concentrate sharply.
| Listed in | Companies | Median holding period (years) | Median total return (%) | Median returns in a year (%) |
|---|---|---|---|---|
| Before 2021 | 260 | 8.1 | 10 | 1.2 |
| 2021 to 2022 | 154 | 4.1 | 11 | 2.6 |
| 2023 to 2024 | 421 | 2.4 | -28 | -12.8 |
| 2025 onwards | 357 | 0.8 | -14 | Not annualised |
The typical listing bought before 2023 is still in profit.
The red ink sits overwhelmingly in the classes of 2023 and later, which account for almost two-thirds of all SME IPOs since 2016.
Read the annualised figures before blaming the vintage alone, though. Even the older winners compounded at only one to three per cent a year, a fraction of what the broader market delivered over the same period.
The recent cohorts may have suffered most. The long-term record was never especially strong.
It was not simply a weak market
The easy defence is that small caps are volatile and SME IPOs merely fell with them.
They did not.
Between September 2016 and July 2026, the Nifty Smallcap 250 returned roughly 285 per cent, or about 14.4 per cent annually. When matched against that index over each stock's own holding window, the median SME IPO lagged by roughly 50 percentage points, and 70 per cent of companies underperformed.
The same comparison also contains the bull case.
On average, SME IPOs beat the benchmark by about 43 percentage points, and the S&P BSE SME IPO Index has risen more than a hundredfold since 2016.
Both facts are true.
Both are also carried by the same thin tail of extraordinary winners.
The index is a price gauge no investor can buy and one that quietly loses its failures as they delist. The case for SME IPOs is ultimately a case for owning the winners.
The median stock, down 13 per cent from listing, shows what owning the category has meant instead.
Why SEBI stepped in
SEBI tightened the rules from July 1, 2025, and each change addresses a weakness visible in the data.
Companies must now report operating profits of at least Rs 1 crore in two of the previous three years, shutting out businesses that qualified largely on paper net worth. Promoters can no longer sell more than one-fifth of the issue, reducing the risk that an IPO becomes an exit in disguise. The minimum application size doubled to Rs 2 lakh, an explicit attempt to slow the retail rush that fuels the listing pop.
The regulator had already signalled its intent in 2024 by cancelling the IPO of Trafiksol ITS Technologies, subscribed nearly 346 times, after tracing parts of the funding chain to a shell company.
Whether tougher gates will eventually produce better companies remains to be seen.
The 270 businesses listed since the rules took effect are down a median 15 per cent from their listing price, with 62 per cent below debut. Most filed under the old regime and all are still young listings, so the only fair conclusion today is that the pop-and-fade pattern has not yet broken.
What it means for you
Two rules follow.
First, the listing price is your cost, not the issue price. Judge the business against what you could actually have paid on day one.
Second, distrust the average.
In a market where a handful of companies rise 50 or 100 times while hundreds halve, the average reflects winners you are unlikely to own.
The median reflects you. And the median SME IPO since 2016 is down 13 per cent from its listing price.
The debut-day excitement was real. For the average buyer, the returns were not.
Still tempted by SME IPOs?
SME IPOs may offer stellar listing-day gains, however, they come with several risks. SMEs still lack transparency regarding the business and financials, unlike companies listed on the mainboard.
If you are still unsure of where to invest, consider subscribing to Value Research Stock Advisor and get analyst-backed stock recommendations, expert advice and in-depth analysis of companies, helping you make smarter and informed investment decisions.
Ask Value Research 
 New episodes every Friday









 New Process Alert
  Seems like you've uploaded a wrong QR code. Please upload the QR code downloaded from MF Central platform.


