

Note: This article has no recommendation to either buy or avoid this IPO. Instead, we have presented all the relevant information based on which you can make your own decision.
 Indo Star Capital Finance is a part of Everstone Group which is a private equity firm with focussed operations in India and Southeast Asia. Set up in 2009 Indo Star initially focussed only on corporate lending. It currently operates in four segments of lending which include corporate lending, SME lending, vehicle finance and housing finance. The corporate and SME lending accounts for 76.7 per cent and 22.7 per cent of its loan book respectively. These two segments have a combined customer base of 897 customers. It has made a recent foray into housing finance and vehicle finance businesses. The two segments combined comprise 1 per cent of the loan book and have a customer strength of just 357. As of December 31, 2017 the size of its loan book stood at Rs 5,147 crore.
Pros
Entry in New Business Lines
Its entry into housing finance and vehicle finance will be future drivers of its growth. Its housing finance division comprises of two business lines: Affordable housing (started in September, 2017) and Retail housing (started in March, 2018). It also entered into vehicle finance business in November, 2017 which will further add to its growth.
Diversification
Increasing focus on diversifying its product mix will reduce its dependence on one business line. It has gradually decreased its dependence on corporate lending from 99.8 per cent in FY15 to 76.8 per cent as on December 2017 of total credit exposure. It is expected to reduce further with entry into new businesses.
Growth
Its loan book and net interest income have grown at a healthy rate of 25.2 per cent and 19 per cent during FY13 to December 2017.
Cons
Concentration
As of December, 2017, 77 per cent of its total credit exposure was towards corporate lending. It's exposure to real estate sector is quite high as it comes up to 41.6 per of its total credit exposure. It has disbursed 94 per cent of its real estate loans in Mumbai alone. Moreover, its top 10 largest performing loans account for 43.1 per cent of total credit exposure in this segment.
NPA(Non Performing Assets)
It has witnessed increasing trend in NPAs. Its gross NPA have risen from 0.2 per cent of gross advances in FY16 to 1.7 per cent of gross advances as of December, 2017. Its net NPA have also witnessed a similar trend due to lack of appropriate provisioning, they have increased from 0.2 per cent in FY16 to 1.4 per cent till December 2017.
Cost of Borrowing
Its cost of borrowing has gradually decreased from 11.9 per cent in FY15 to 9.1 per cent as of December, 2017. Even though their borrowing costs have declined, they still remain above their peers.
Where is the money going?
Total Issue Size -- Rs 1,844 crore
Fresh issue
Increasing Capital -- Rs 700 crore
Offer for sale -- Rs 1,144 crore
Indostar Capital -- Rs 1,059 crore
Other Shareholders -- Rs 85 crore
Additional details
- Price band: Rs 570-572
- Subscription dates: 9-11 May
- Post-IPO valuation: Rs 5,688 crore
- Net interest income (FY17): Rs 332 crore
- Profit after tax (FY17): Rs 211 crore
- ROE (FY 17): 12.2 per cent
- ROA (FY 17): 4.1 per cent
- Capital adequacy ratio (December 31, 2017): 31.6 per cent
- Loan book (December 31, 2017): Rs 5,147 crore
- Gross NPA (December 31, 2017): 1.73 per cent
- Net NPA (December 31, 2017): 1.37 per cent
- Promoters: Indostar Capital
- Retail Allocation: 35 per cent
- Lead managers: JM Financial, Kotak Investment Banking, Morgan Stanley, Motilal Oswal Investment Advisors, Nomura Financial Advisory
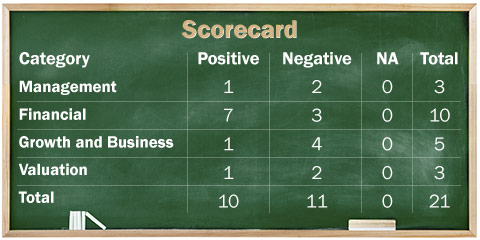
Management
1. Has the company been free of any regulatory penalties?
Yes, however RBI has found some deficiencies in its inspections related to calculation of capital adequacy ratio, credit appraisal process, interest rate pricing and potential NPA accounts.
2. Does the company adequately provide for its non-performing assets (NPAs)? More specifically, is the ratio of provisions to Gross NPAs more than 50 per cent?
No, its provision coverage ratio was just 20.5 per cent as of December,2017. It may have to make additional provisions in future due to increasing trend of NPAs.
3. Do the top five managers have stock as meaningful part of their compensation (More than 50 per cent)?
No, Company has ESOP Plan. But, no meaningful ESOPs were given to key managerial personnels as part of FY18 compensation package.
Financial Strength and stability
1. Does the company have fresh slippages to total advances ratio of less than 0.25 per cent? (Fresh slippages are loans which have become NPAs in the last financial year).
No, Indo Star had fresh slippages of 1.47 per cent of its last year's AUM based on FY17 financials. Company`s gross NPA increased from Rs 10 crore in FY16 to Rs 72.7 crores in FY17 leading to higher slippages.
2. Did the company generate a current and 4-year average return on equity (RoE) of more than 12 per cent and return on assets (RoA) of more than 1 per
Yes, the company generated four year average ROE and ROA of 12.1 per cent and 4.2 per cent respectively.
3. Did the company increase its loan book by 20 per cent annually over the last four years?
Yes, its loan book has increased at a healthy CAGR of 30.6 per cent during from 2013-17 from Rs 1,767 crores in 2013 to Rs 5,145 crores in 2017. It may not continue to grow at the same pace in the future due to higher base effect. However, its loan book has shown no growth in past 9 months.
4. Did the company increase its Net Interest Income (NII) by 20 per cent annually over the last four years? (Net interest income is the difference between the revenue that is generated from a bank's assets and the expenses associated with paying out its liabilities).
Yes, its net interest income has grown by 28 per cent during the 2013-17 period. It grew from Rs 124 crore in FY13 to Rs 332 crore in FY17.
5. Is there a direct relationship between the increase in loan book and the increase in Net Interest Income (NII)?
Yes, they both appear to move in line with each other with a very strong correlation of 0.91 (Correlation of 1 indicates perfect relationship with each other).
6. Is the company's capital adequacy ratio more than 15 per cent? (The capital adequacy ratio (CAR) is a measure of a bank's capital. It is expressed as a percentage of a bank's risk weighted credit exposures).
Yes, as on December 31,2017 its capital adequacy ratio stood at 31.6 per cent in comparison to 15 per cent mandated by RBI. Further, the proceeds raised from IPO will be used for increasing capital base.
7. Can the company run its business without relying on external funding in the next three years?
No, the company is expanding its housing and vehicle finance business which may lead to higher capital requirements in the near future. Its sustainable growth rate (maximum growth a company can achieve without being dependent on external funding) is also close to 12 per cent which is less than its current growth rate of close to 30 per cent.
8. Did the company generate average NIM of more than 3 per cent in last 5 years? (Net interest margin or NIM denotes the difference between the interest income earned and the interest paid by a bank or financial institution relative to its interest-earning assets like cash).
Yes, the company generated average NIM of 6.5 per cent during the period FY13 to FY17.
9. Is the Average Gross NPA Ratio (Gross NPAs/Total Advances) over the last 3 years less than 1 per cent and the Net NPA Ratio (Net NPAs/Total Advances) less than 0.5 per cent?
No, its three year average gross and net NPA ratios stand at 0.7 per cent and 0.6 per cent respectively. Its current gross and net NPA ratios are also on an increasing trend and currently stand at 1.7 per cent and 1.4 per cent respectively as on December 2017.
10. Does the company have a cost-income ratio of less than 50 per cent?
Yes, its five year average cost to income ratio stands at 17.2 per cent. But, it has increased to 27.6 per cent for the nine months period till December 2017.
Growth and Business
1. Will the company be able to scale up its business?
Yes, the company is currently expanding its housing and finance vehicle portfolio. Geographically, most of its exposure is in and around Mumbai. By adopting the twin mode of expanding geographically while growing its new portfolios, it has huge scopes of growth. Moreover, government push towards affordable housing will further give it an impetus.
2. Does the company have a loan book of more than Rs 100,000 crores?
No, Indo Star has a loan book of Rs 5,147 crores as of December 31,2017.
3. Does the company have a recognizable brand, truly valued by its customers?
No, it is a small company operating in a highly competitive industry where interest rates play a very vital role. Player offering lower interest rates will capture the market.
4. Does the company have a credible moat?
No, size is a big moat in the lending business with big and well-diversified lenders protected better from defaults. Indo Star is a small company with a small book size and with little ability to withstand major financial shocks.
5. Is the level of competition faced by the company, relatively low?
No, it operates in a highly competitive industry. It faces stiff competition from large banks, small finance banks, non banking financial companies and microfinance companies.
Valuation
1. Is the company's price to earnings ratio less than its peer median level?
No, it is priced at a PE of 27 based on post IPO fully diluted earnings which is slightly above the industry median PE of 25.8.
2. Is the company's price to book value less than its peer median level?
Yes, its price to book stands at 2.05 based on fully diluted post IPO basis which is less than the industry median of 3.34.
3. Is the company's PEG ratio less than 1? (The price/earnings to growth ratio (PEG ratio) is a stock's price-to-earnings (P/E) ratio divided by the growth rate of its earnings for a specified time period).
No, its PEG ratio stands at 1.03 times based on 4 year CAGR earnings growth.
Ask Value Research ![]()