
Public-sector undertakings (PSUs) are famous for their hoards of cash. Although PSUs' total cash and equivalents have fallen in the past five years, the ratio of cash as per cent of market capitalisation still remains high. If they are seen individually, most PSUs are trading at record highs in terms of their cash reserves as per cent of market capitalistion. Cash reserves run as high as 95 per cent in the case of MRPL (Mangalore Refinery and Petrochemicals). But MRPL is a miscellaneous case. It is an 'indirect' PSU (government doesn't hold it directly but via other PSUs) and its high cash is due to high unpaid creditors. MOIL, a debt-free company, has cash and equivalents of ₹2,940 crore, which are 74.4 per cent of its market capitalisation. Similarly, there are six PSUs in all which have cash of more than 50 per cent of their market capitalisations; and there are 11 PSUs with cash more than 40 per cent of their market caps.
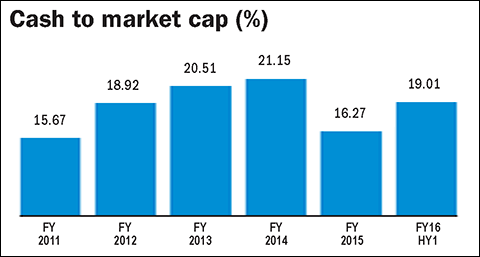
Tracking PSU cash
| Cash & equiv | Market cap | |
| FY16HY1 | 209467 | 1101631 |
| FY2015 | 209101 | 1285243 |
| FY2014 | 228365 | 1079694 |
| FY2013 | 224455 | 1094501 |
| FY2012 | 230887 | 1220510 |
| FY2011 | 232358 | 1483028 |
| FY16 data as of September 2015. | ||
There are two major reasons for the such high cash-to-market-capitalisation ratios. PSUs traditionally trade at low valuations, so their market caps are comparatively smaller, thus boosting the cash-to-market-cap ratio. The second reason is that they haven't been able to spot investment opportunities to deploy their huge cash reserves. The government has frequently asked PSUs to either invest their cash hoards or pay out dividends to the shareholders. This explains why many PSUs have high dividend yields. Are dividend investors listening?
Cash-rich PSUs
| Company Name | Sector | Market Cap (₹cr) | Cash & Equiv (₹cr) | Cash to Mcap (%) |
| MRPL | Crude Oil | 12224 | 11359 | 92.92 |
| Mysore Paper Mills | Paper | 55 | 41 | 74.95 |
| MOIL | Mining | 3981 | 2940 | 73.86 |
| Orissa Minerals Development | Mining | 1182 | 772 | 65.29 |
| Oil India | Crude Oil | 19609 | 10730 | 54.72 |
| NMDC | Mining | 35920 | 19069 | 53.09 |
| NALCO | Metals | 11095 | 5369 | 48.39 |
| PTC India | Power | 1917 | 804 | 41.96 |
| Neyveli Lignite | Power | 11501 | 4768 | 41.46 |
| Shipping Corpn | Logistics | 3435 | 1305 | 37.98 |
| Engineers India | Capital Goods | 6240 | 2313 | 37.07 |
Ask Value Research ![]()