
Summary: Just 50 companies account for two-thirds of the Nifty 500. When smaller stocks collapse, they barely move the headline number. Here's what the index is actually telling you and what it's hiding.
Market corrections often confuse investors. You open the financial news and see the index down around 15-20 per cent from its peak. Uncomfortable, yes, but hardly catastrophic.
Then you open your portfolio. Many stocks are down 30 per cent. Some 40 per cent. A few look like they have fallen off a cliff.
This raises an interesting question: if the index is down only 15-20 per cent, why are so many stocks falling much more? The answer lies in something most investors rarely think about, how stock market indices are constructed.
Beneath the surface
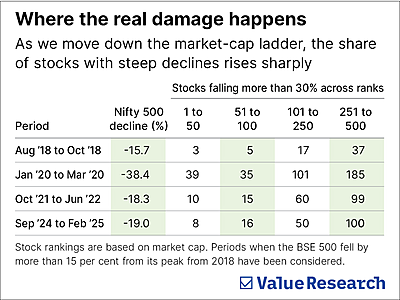
Popular indices such as the BSE 500 often mask what is really happening beneath the surface of the market. As we move down the market-cap ladder, a larger share of stocks tends to fall sharply during corrections compared with the largest companies.
To illustrate this, we examined periods since 2018 when the BSE 500 fell more than 15 per cent from its peak. The 500 stocks were divided into four groups based on market capitalisation: 1-50, 51-100, 101-250 (mid caps) and 251-500 (small caps).
While stocks ranked 1-100 together broadly represent the large-cap universe, we split them further to highlight the outsized influence of the top 50 companies on the index.
We then analysed how many stocks in each bucket fell by more than 30 per cent during these market correction periods. The pattern is clear. During the Covid-led correction between January and March 2020, the index fell about 38 per cent. Yet within the index, roughly 360 stocks had fallen more than 30 per cent.
And the deeper we move down the market-cap ladder, the sharper the damage becomes. Yet the headline index number often appears far less severe. To understand why, we need to examine how indices are constructed.
How indices are built
Indices such as the Nifty 500 are market-cap weighted. Larger companies carry much greater influence on the index’s movement.
Think of it like a weighted average in school. If an external exam counts for 65 per cent of your final grade and an internal exam for 35 per cent, a poor internal score barely moves the final result compared with a poor external score.
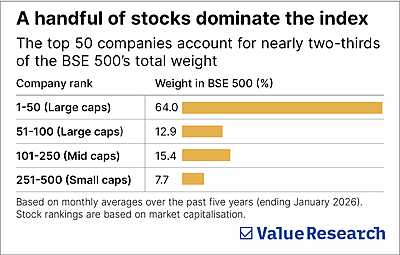
The same logic applies to stock indices. Just 50 companies account for around two-thirds of the entire index. The bottom 250 companies together account for just 7 per cent. So when smaller companies collapse during market corrections, they simply do not have enough weight to drag the index down with them. Large companies, typically more stable, dominate the headline number investors see.
The equal-weight test
Now imagine a version of the Nifty 500 where every stock carries the same weight, roughly 0.2 per cent each, whether it is a giant like Reliance or a relatively small company.
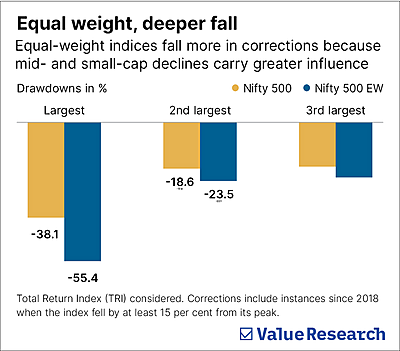
This is essentially how the Nifty 500 Equal Weight (EW) index works. In such a structure, smaller companies receive far greater representation. Stocks ranked 251-500 together account for nearly half the index, whereas in the regular Nifty 500 their combined weight is less than 10 per cent.
As a result, mid- and small-cap movements have a much stronger influence on the equal-weight index. When we compare major drawdowns since 2018, the equal-weight version consistently falls more sharply than the regular Nifty 500. The reason is straightforward: by giving mid- and small-cap stocks a larger role, the index becomes far more sensitive to their steeper declines. There is no cushion from dominant large-cap stability.
This comparison is not meant to suggest that equal-weight indices are inferior. They have their own strengths and often perform well during strong bull markets.
The purpose here is simply to highlight how weight distribution alone can lead to different outcomes, even when both indices contain the same set of stocks.
In other words, a market-cap weighted index reflects the movement of the largest companies far more than the average stock.
The hidden advantage of indices
All this reveals something interesting about traditional market-cap weighted indices. They come with built-in stabilisers.
First, large companies dominate the weight, providing a strong anchor.
Second, those companies tend to fall less during market corrections, which helps moderate the overall market decline.
Third, indices still offer diversification across hundreds of companies, limiting the damage caused by any single stock collapse.
Put together, these features make indices naturally more resilient than many portfolios built around a handful of individual stocks. This is one reason investors concentrated in mid- or small-cap stocks often experience sharper volatility than the broader market index.
This article was originally published on March 20, 2026.
Ask Value Research ![]()