
Summary: A portfolio of companies with high promoter pledges returned 4.55 per cent annually over 16 years. The Nifty 500 returned 12.31 per cent. The gap is what ignoring forensic analysis actually costs.
A good investor reads balance sheets. A great investor reads between the lines.
Every checklist has its limits. Earnings look strong, margins are expanding, and the brand is recognised. There are many companies which passed the standard test before failing the only one that ultimately matters: honesty.
The gap between a convincing and an honest financial statement is where Forensic and Governance (F&G) analysis lives. Forensic asks whether the numbers hold together: are reported profits backed by actual cash flow, or dressed up by accounting choices? Governance asks whether the people in charge can be trusted: how do promoters behave, what do related-party transactions reveal, and are disclosures consistent or conveniently vague? Together, they serve one purpose: identifying companies worth avoiding before the market reaches the same conclusion.
Why F&G analysis matters more than most investors think
Think of a detective who rules out the innocent before pursuing the guilty. F&G analysis works the same way: remove the landmines first, then evaluate what remains on its own merits.
Some companies exploit the market’s patience for a good narrative. Revenue gets recognised ahead of collection. Costs get capitalised rather than expensed. One-off gains get folded into recurring income. Working capital gets stretched until profits look healthy and cash quietly vanishes. The tell is almost always there.
Satyam Computers fabricated bank confirmations and inflated cash balances for years. IL&FS Transportation reported capital work-in-progress that never converted into productive assets, while promoter pledges remained stubbornly high.
Manpasand Beverages saw auditor fees rise sharply across consecutive years. Jet Airways carried contingent liabilities that dwarfed its net worth. In each case, red flags preceded the collapse. The data spoke, but most investors were not looking for it.
Two concepts explain why F&G analysis cuts through: earnings quality and reporting quality. The first checks whether profits are converting into sustainable cash flows. The second asks whether the auditor is independent enough to be believed. Even businesses with impressive performance can fail both tests. High ROE is not a defence against hidden liabilities or compromised disclosures.
Quantifying the red flags
F&G analysis is often mischaracterised as subjective. Red flags can also be quantified and screened systematically.
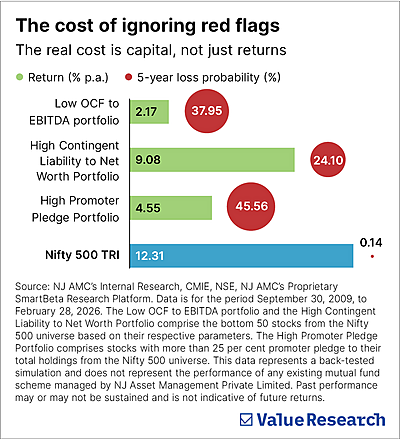
Promoter pledge: When a promoter pledges shares as collateral, the stock becomes leverage in someone else’s financial position. A falling price triggers forced selling, which can drive it lower still. A portfolio comprising companies having high promoter pledges delivered an annualised return of just 4.55 per cent between September 2009 and February 2026, against the Nifty 500 TRI’s 12.31 per cent, with a five-year loss probability of 45.56 per cent.
Operating cash flow (OCF) to EBITDA: Profits can be shaped by accounting choices. Cash flows are harder to manufacture. When operating cash flow falls persistently short of reported EBITDA, the income statement is flattering the business. The Low OCF to EBITDA portfolio returned just 2.17 per cent annually, with a 37.95 per cent chance of loss over five years.
Contingent liabilities to net worth: Off-balance-sheet obligations, pending litigation and unresolved claims can accumulate until they overwhelm a company’s financial buffer.
High contingent liability portfolios returned 9.08 per cent annually, with a 24.10 per cent five-year loss probability. The Nifty 500 TRI’s equivalent figure was just 0.14 per cent. The gap is the cost of ignoring red flags.
Elimination over selection
Sometimes, even high-quality companies can fail the F&G test. F&G analysis is not a replacement for quality; it is the necessary second layer. F&G analysis does not promise outperformance. It promises fewer landmines.

Even from a universe of 100 high-quality stocks (NJ Quality+), the bottom 20 companies as per their F&G ranking trail significantly behind the rest of the stocks with a 14.81 per cent loss probability and returns of just 9.70 per cent per annum. As opposed to this, the remaining top 80 companies carry a three-year loss probability of just 0.28 per cent and a five-year median rolling return of 22.43 per cent per annum.
NJ AMC’s quantitative Forensic and Governance model is built on this logic, using quantitative screens to systematically detect red flags across its universe.
While quality gets you into the right neighbourhood, Forensic and Governance make sure you are not buying the house next to a crime scene.
Also read: Power of a balanced line-up
Ask Value Research ![]()