Kotak MSCI India ETF opened for public subscription on January 29, and will remain open until February 12.
This is the first time an Indian fund will track the MSCI India Index.
But despite its novelty, it doesn't offer anything new.
Before we explain why, here's a quick look at the ETF details.
Kotak MSCI India ETF NFO snapshot
| NFO period | January 29 to February 12, 2025 |
| Benchmark | MSCI India index |
| Fund manager (s) | Devender Singhal, Satish Dondapati and Abhishek Bisen |
| Expense ratio | Up to 1 per cent |
| Tax treatment | If units are sold within a year, capital gains will be taxed at 20 per cent. If units are sold after a year, capital gains will be taxed at 12.5 per cent. However, gains of up to Rs 1.25 lakh are tax-exempt. |
About MSCI India Index
The index, which is maintained by MSCI (Morgan Stanley Capital International), is home to the top 85 per cent of India's equity market.
They will calculate this as per the company's market value.
As of December 21, 2024, the MSCI India Index is home to 156 largest companies in the country.
Is 156 an odd number? That's because these are the companies that make up 85 per cent of India's equity market.
In the future, if 120 or 180 stocks come to represent 85 per cent of the market, that's how many stocks will make up the index. It's all about reflecting the top 85 per cent, no matter the exact number.
Essentially, they exclude stocks that have low trading volumes or those that are highly illiquid.
MSCI India Index is almost like Nifty 200
The MSCI India Index and Nifty 200 Index are practically twins, with a whopping 89 per cent overlap.
So, for the rest of this story, we'll be putting MSCI India side-by-side with its almost identical sibling—Nifty 200.
The MSCI India Index's top-ten stocks have a 37.4 per cent weightage, almost similar to Nifty 200 TRI's 37 per cent.
The top five sectors of the MSCI India Index are: Financials (27.2 per cent), Consumer Discretionary (13.1 per cent), Information Technology (12.1 per cent), Industrials (9.1 per cent) and Energy (8.3 per cent), which together account for 69.8 per cent of the index. In comparison, the top five sectors of the Nifty 200 make up about 64.6 per cent, showing a similar distribution to that of the MSCI India Index.
Returns
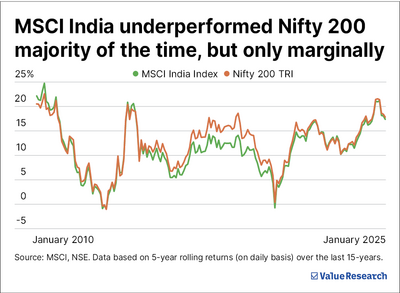
Over a 15-year period, the MSCI India Index has underperformed the Nifty 200 TRI 80 per cent of the time based on five-year rolling returns, though the margin is thin. MSCI India Index has delivered an annualised average five-year return of 11.5 per cent, slightly lower than Nifty 200 TRI's 12.5 per cent.
Now, let's compare the returns of these two indices during bullish (rising) and bearish (falling) phases over the past 15 years.
To do this, we identified periods when broad market indices like the Sensex moved up or down by at least 20 per cent. The table below presents the results.
MSCI India index vs Nifty 200 in different phases
Both indices fall almost similar in bearish phase;Nifty 200 outperforms during bearish phases
| Bearish periods | MSCI India Index | Nifty 200 TRI |
|---|---|---|
| 10-May-06 to 14-Jun-06 | -30.30% | -31.90% |
| 09-Jan-08 to 09-Mar-09 | -63.90% | -62.90% |
| 08-Nov-10 to 20-Dec-11 | -28.40% | -30.20% |
| 30-Jan-15 to 11-Feb-16 | -17.90% | -18.40% |
| 15-Jan-20 to 23-Mar-20 | -37.00% | -37.90% |
| Bullish periods | MSCI India Index | Nifty 200 |
|---|---|---|
| 16-Oct-06 to 08-Jan-08 | 71.10% | 81.30% |
| 31-Oct-13 to 29-Jan-15 | 36.20% | 50.00% |
| 05-Apr-17 to 14-Jan-20 | 31.00% | 31.60% |
| 10-Nov-20 to 29-Dec-23 | 79.70% | 88.20% |
What we noticed is that both MSCI India Index and Nifty 200 are practically joined at the hip when the market falls more than 20 per cent.
But when the markets do well, Nifty 200 TRI surged ahead in all the four instances. Out of the four bullish phases mentioned, it outperformed the MSCI India Index by an average of 8.3 per cent.
Should you invest?
The index doesn't offer anything that domestic indices like NSE or BSE don't already provide.
Designed for international investors with a bullish view on India, it's not as useful for Indian investors who have plenty of local options.
Even if the returns were spectacular, we could look past these points. But, as we've seen, the MSCI India Index lags behind Indian indices like Nifty 200, especially in bullish phases.
Also read: Can Nifty 100 Equal Weight Index fund earn you more than Nifty 100 fund?
Ask Value Research ![]()