


SBI Life Insurance Company Ltd.
NSE: SBILIFE | BSE: 540719
₹1,829.40
As on 17-Jul-2026IST
Market cap
₹1,83,797 Cr
Revenue (TTM)
₹-- Cr
P/E Ratio
129
P/B Ratio
9.6
Div. Yield
0.1 %
Stock Range
Today’s Range
52 Week Range
Liquidity![]()
Fundamentals
-
Net Profit (TTM)

₹2,470 Cr
-
ROE
13.8 %
-
ROCE
14.1 %
-
Industry P/E
112.4
-
EV/EBITDA
114
-
Debt to Equity
0
-
Book Value
₹190.2
-
EPS
₹24.6
-
Face value
10
-
Shares outstanding
1,003,261,050
10 Years Aggregate
CFO
₹2,15,268.34 Cr
EBITDA
₹-35.67 Cr
Net Profit
₹16,313.82 Cr
Performance
|
Company
|
YTD
|
1 Month
|
3 Months
|
1 Year
|
3 Years
|
5 Years
|
10 Years
|
|---|---|---|---|---|---|---|---|
|
SBI Life Insurance
| -10.1 | 3.5 | -7.4 | 0.0 | 11.5 | 11.7 | -- |
|
BSE Sensex
| -7.7 | 1.7 | 0.2 | -5.4 | 5.8 | 8.0 | 10.9 |
|
BSE Finance
| -2.1 | 3.2 | 3.9 | -0.1 | 10.2 | 9.9 | 11.7 |
|
Company
|
2025
|
2024
|
2023
|
2022
|
2021
|
2020
|
2019
|
|---|---|---|---|---|---|---|---|
|
SBI Life Insurance
| 45.3 | -2.9 | 16.3 | 3.0 | 33.6 | -7.4 | 60.6 |
|
BSE Sensex
| 9.1 | 8.1 | 18.7 | 4.4 | 22.0 | 15.8 | 14.4 |
|
BSE Finance
| 15.7 | 8.7 | 17.1 | 11.1 | 14.1 | 0.8 | 18.0 |
Essential Checks
View DetailsIs there a threat to the company's solvency?
Can creative accounting be detected through the financial numbers?
How did the company perform in the last one year?
Financials
View DetailsKey Ratios
View Details
5Y Avg -- 3Y Avg -- TTM --
P/E Ratio
--
--Min --Median --Max
P/B Ratio
--
--Min --Median --Max
Earnings Yield (%)
--
Earnings Yield (%) = EBIT / Enterprise value
PEG Ratio
--
Price = Price / Earnings to growth ratio
Peers
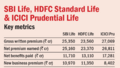
View DetailsCompany |
Price (₹) | Market Cap (₹ Cr) | Revenue (TTM) | Net Profit (TTM) | OPM (%) | ROE (%) | P/E | P/B |
|---|---|---|---|---|---|---|---|---|
|
SBI Life Insurance
|
1,829.4 | 1,83,797.4 | 99,955.9 | 2,470.3 | -11.6 | 13.8 | 129 | 9.6 |
| 563.7 | 1,22,429.8 | 79,948.7 | 1,975.2 | -28.2 | 10.6 | 62 | 6.3 | |
| 1,612.2 | 80,508.3 | 23,077.5 | 2,428.0 | -6.5 | 14.6 | 33.2 | 4.7 | |
| 497.2 | 72,039.6 | 52,581.8 | 1,684.5 | -25.9 | 12.1 | 42.8 | 5.1 | |
| 433.1 | 5,48,124.3 | 5,37,603.8 | 57,453.2 | -74.3 | 37.7 | -- | 3.0 | |
| 1,538.0 | 53,063.1 | 47,674.1 | 105.6 | 0.4 | 1.6 | 631.9 | 10.0 | |
| 256.3 | 8,764.6 | 8,449.4 | 73.2 | 0.9 | 3 | 102 | 2.8 |
Shareholding Pattern
View DetailsNews & Analysis
All News

3 min read•By Danish Khanna

2 min read•By Jugal Harpalani
Assessing life insurance companies
2 min read•By Research Desk

Making sense of the life-insurance sector
2 min read•By Value Research

3 min read•By Dhirendra Kumar
About SBI Life Insurance
SBI Life Insurance Company Limited operates as a private life insurance company in India. The company's life insurance business comprises individual and group life insurance products, including participating, non-participating, pension, group... gratuity, group leave encashment, group superannuation, group immediate annuity, unit-linked and variable insurance products, health, and micro insurance. It also provides accident and disability benefit, level term, and critical illness insurance products. In addition, the company offers online savings, protection, retirement, and child life insurance plans, as well as wealth creation with insurance products; and corporate solutions, group loan protection, and group micro insurance plans. It offers its products through a multi-channel distribution network comprising individual agents, brokers, corporate agents, bancassurance partners, and certified insurance facilitators, as well as through various partner branches. The company was incorporated in 2000 and is based in Mumbai, India. SBI Life Insurance Company Limited is a subsidiary of State Bank of India. Read more
-
Incorporated
2000
-
Chairman
Challa Sreenivasulu Setty
-
Managing Director
Amit Jhingran
-
Group
PSU - SBI
-
Headquarters
Mumbai, Maharashtra
-
Website
Looking for more details about SBI Life Insurance Company Ltd.’s IPO? Explore our IPO Details page.
Value Research Ratings
Our rating system has guided millions of investors in the past 20 years.
Quarterly Updates
Annual Reports
Announcements
View AnnouncementsIntimation Of 26Th Annual General Meeting
13-Jul-2026Cancellation Of Investor/ Analyst Meet
04-Jun-2026No News & Announcements are available.
FAQs for SBI Life Insurance
What is the current share price of SBI Life Insurance Company Ltd Today?
The share price of SBI Life Insurance Company Ltd is ₹1,829.40 (NSE) and ₹1,832.00 (BSE) as of 17-Jul-2026 IST. SBI Life Insurance Company Ltd has given a return of 11.48% in the last 3 years.
What is the current PB & PE ratio of SBI Life Insurance Company Ltd?
The P/E ratio of SBI Life Insurance Company Ltd is 129.04 times as on 17-Jul-2026, a 15 premium to its peers’ median range of 112.40 times.
The P/B ratio of SBI Life Insurance Company Ltd is 9.63 times as on 17-Jul-2026, a 54 premium to its peers’ median range of 6.26 times.
PE & PB ratio at the end of financial year.
| Year | P/E Ratio | P/B Ratio |
|---|---|---|
|
2026
|
72.18
|
9.35
|
|
2025
|
64.28
|
9.24
|
|
2024
|
79.21
|
10.28
|
|
2023
|
63.97
|
8.52
|
|
2022
|
74.41
|
9.82
|
What is the 52 Week High and Low of SBI Life Insurance Company Ltd?
The 52-week high and low of SBI Life Insurance Company Ltd are Rs 2,132.00 and Rs 1,700.40 as of 19-Jul-2026.
What is the market cap of SBI Life Insurance Company Ltd?
SBI Life Insurance Company Ltd has a market capitalisation of ₹ 1,83,797 Cr as on 17-Jul-2026. As per SEBI classification, it is a Large Cap company.
Should I invest in SBI Life Insurance Company Ltd?
Before investing in SBI Life Insurance Company Ltd, assess your goals, risk tolerance, and if the company aligns with your long-term plan. Carefully review its business model, financials, and valuation. Avoid making decisions based on tips or short-term trends.