We have all been there. It's past midnight, and the late-night munchies have kicked in. You browse through your go-to delivery app, and voila, you are munching on a pizza within 30 minutes.
But if you rewind the clock just a decade back, leftovers would have been your only saviour.
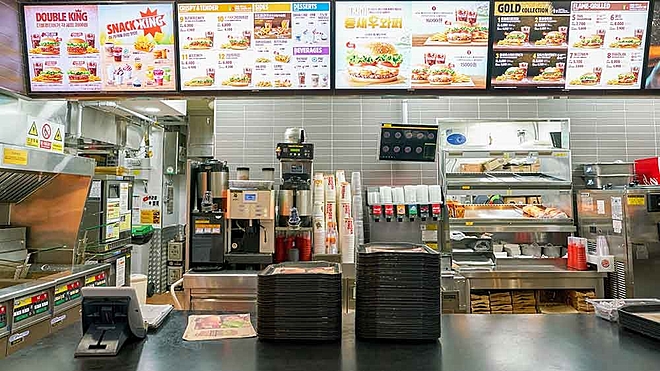
Quick service restaurants (QSRs), the stores that promise to put food on your table within minutes, have revolutionised our lives. And it's not just about the food. In 2021, the industry employed nearly 70 lakh people.
So there's no denying that QSR as an industry is here to stay and has shown stellar growth in a very short time.
But as an investor, there's only one question in our mind. Given QSRs' unique business, how does one go about analysing QSRs?
Evaluating QSRs
The QSR space in India is dominated by these big five: Devyani International (Pizza Hut, KFC and Costa Coffee), Jubilant Foodworks (Domino's), Westlife Foodworld (McDonald's), Sapphire Foods (Pizza Hut and KFC) and Restaurant Brands Asia (Burger King).
While the usual metrics are indeed helpful, here are five metrics you should look at when evaluating QSRs.
Employee cost as a percentage of sales: This metric represents how efficiently a company is using its employees. It is calculated by dividing employee costs by sales. A high employee cost as a percentage of sales indicates that the company is overstaffed, paying high wages or not utilising its staff efficiently. In contrast, a lower number indicates that the company is managing the staff cost-efficiently.

New store addition: This one might not come as a surprise. More restaurants mean more customers, which means higher revenue. Typically, QSRs set up their outlet in densely populated areas to maximise their reach.

Delivery as a percentage of total orders: This metric has become especially useful since the rise of online food ordering. It is a useful indicator of how much of a restaurant's business is coming through delivery orders. It is calculated by dividing the number of delivery orders by the total number of orders.
Having a higher number of delivery orders is beneficial for QSR stores. Say the annual revenue of a QSR is Rs 1,000 crore, and it has to pay Rs 200 crore as annual rent as it provides dine-in facilities. However, the orders it receives in its dine-in facilities barely make up for the rent. In addition, it has to incur additional charges to maintain the dine-in store.
Now if it receives a high amount of delivery orders, it can simply choose to stop its dine-in services, reduce the size of its store and cut down on rent and make higher profits.
Jubilant FoodWorks has the highest ratio of 62.5 per cent of delivery as a per cent of total orders amongst its peers. This gives it the liberty to shut down dine-in stores without much sacrifice to its topline.
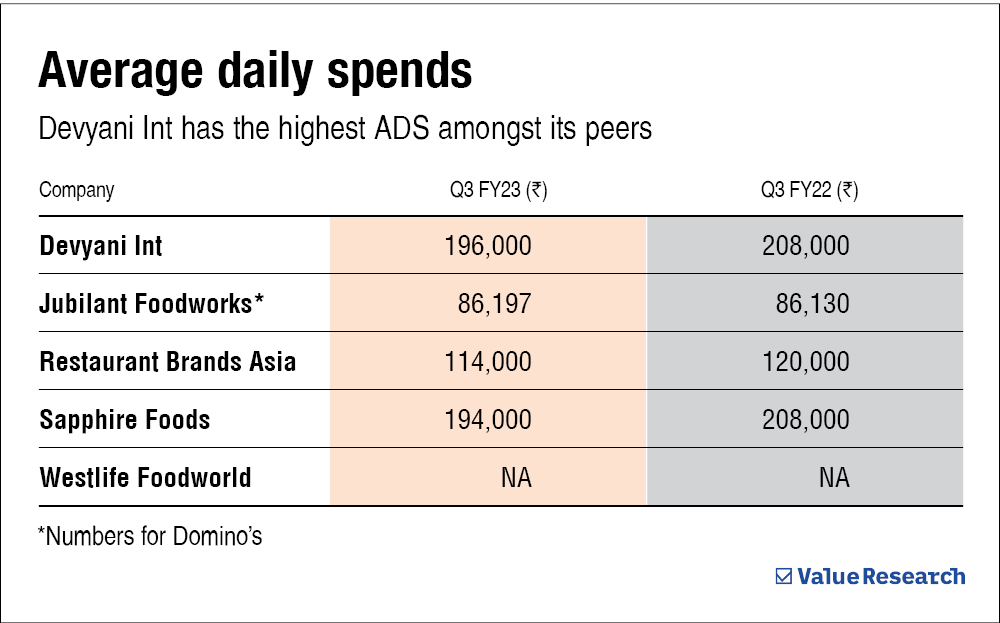
Average daily spend (ADS): This is a measure of how much customers are spending on a daily basis in a QSR. QSRs have multiple fixed costs, such as delivery costs, employee salaries, etc. So, if customers are spending more on a daily basis, these fixed costs become easier to manage.
Same-store sales growth (SSSG): Suppose a QSR had opened 100 stores in FY21 and recorded sales of Rs 1,000 crore. Now in FY22, it added 50 new stores, and its revenue shot up to Rs 3,000 crore.
But why? Was it better performance from existing stores, or was it all just the contributions from the new stores?
This is where same-store sales growth (SSGS) comes in handy. It is used to evaluate the performance of existing stores.
In the above example, say the 100 older stores that were open for business in FY21 generated revenue of Rs 2,500 crore in FY22. Thus, the same-store sales growth would be calculated by comparing Rs 2,500 crore with Rs 1,000 crore instead of Rs 3,000 crore.
So, SSGS = (Rs 2,500 crore/Rs 1,000 crore - 1) * 100 = 150 per cent
In this way, QSRs can have a better understanding of the performance of individual stores. A rise in SSSG means that existing stores are performing well. In contrast, a dip in SSSG indicates the opposite.
For instance, Westlife Foodworld reported a decline in SSSG from a 40 per cent decline in Q3FY22 to 20 per cent in Q3 FY23.
Suggested read: Five smart money moves to make in 2023
This article was originally published on February 24, 2023.
Disclaimer: This content is for information only and should not be considered investment advice or a recommendation.
For grievances: [email protected]
Ask Value Research ![]()