This is the P/E chart of the famous Info Edge. As you can see, this company was trading at a price-to-earnings of around 56 times which all of a sudden dropped to around 9 times in October 2021 and further dropped to around 5 times in January 2022. In order to understand why such a fall happened, we need to understand what causes the price-to-earnings to change.
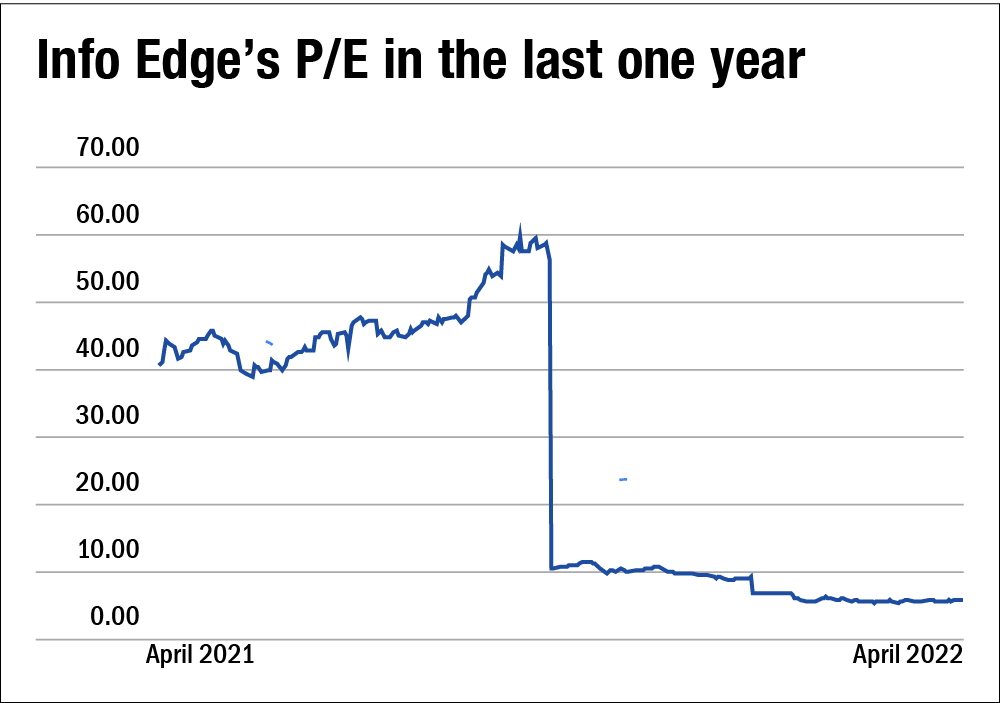
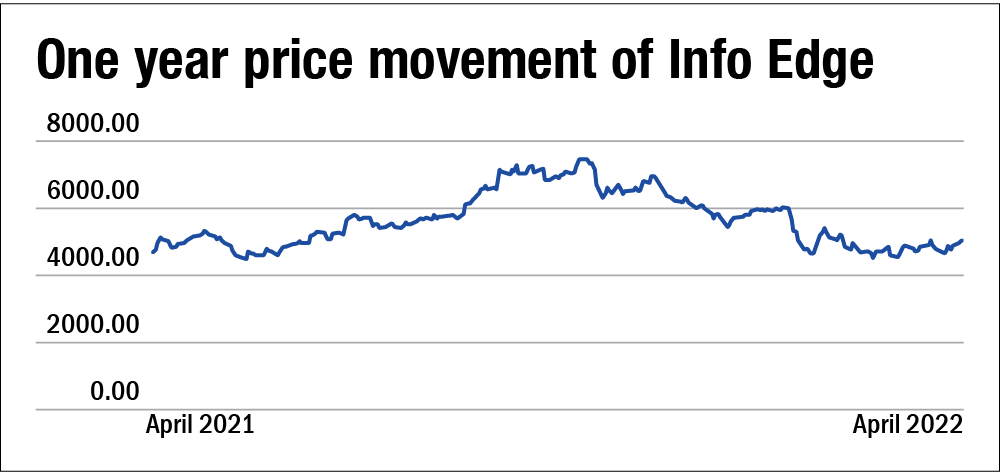
The formula for price-to-earnings (P/E), as the name says, is the price of a share divided by TTM (trailing twelve months) earnings per share or EPS. P/E can change either due to a fall in the share price of the company or an increase in earnings per share of the company. As we can see in the price chart, although the price dipped a bit in the month of January, the fall was not significant enough to cause a drastic plunge in the P/E of the share.
Now that we have ruled out the fall in price as an explanation, another explanation would be a sudden and massive increase in earnings per share of the company and that's what happened too, but with a slight twist. The increase in EPS was not because the company managed to increase its revenue or decrease its cost which led to an increase in profit, it was because of exceptional items.
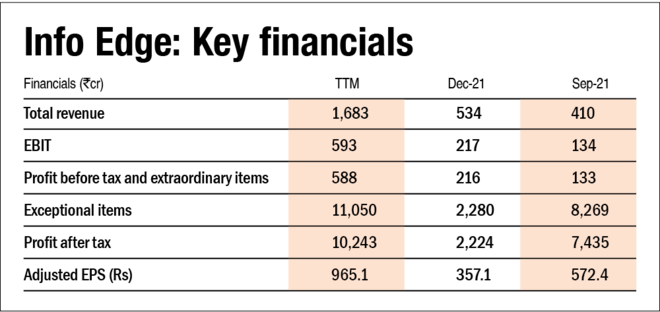
Info Edge sold 49.3 million shares in the Zomato IPO and still continues to hold a 15.18 per cent stake in the company. Thus in the last two quarters, the company recorded profit on the sale of shares in the IPO and gain in the value of their investments in Zomato post listing as exceptional items in the profit and loss account. This got reflected in the EPS of the respective quarters which in turn led to a drop in P/E of the company.
Will this continue going forward?
Although the company recorded the gains as exceptional items in the last two quarters, this will not continue in the future. The unrealised (since they have not sold their stake yet) gains due to the change in fair value of their investment in Zomato will be taken to other comprehensive income and will not be reflected in profit and loss going forward. Other comprehensive income includes gains and losses which are yet to be realised, and are thus excluded from the profit and loss statement. Thus, in the upcoming quarters, Info Edge's EPS will decrease due to the absence of huge exceptional items which will start reflecting on the company's P/E.
Disclaimer: This content is for information only and should not be considered investment advice or a recommendation.
For grievances: [email protected]
Ask Value Research ![]()