


Over the past few years, liquidity squeeze has taken a heavy toll on the country's real estate sector. Although demonetisation was believed to be responsible for the crisis, the problem started much before the demonetisation shock. In this article, we delve deep into the main reasons behind the liquidity crisis.
Inventory pile-up
As depicted in the table below, a consistent rise in unsold stocks led the real estate inventory to reach a very high level and it would take around 41 months to clear this inventory as compared to an outstanding inventory of 16 months in 2009.
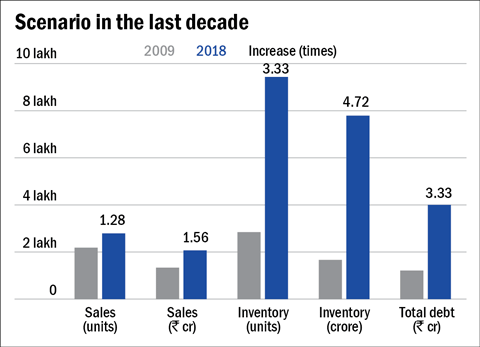
Sales, on the other hand, clearly lagged far behind. Adding to the woes were the new developers who kept entering the market with additional housing stock, thereby widening the gap between demand and supply and increasing the debt in the sector. All these ultimately contributed to a growing inefficiency in the sector.
Further, with the market consolidating to a large extent, it slowly became tougher for small-scale developers to survive. As a result, some of them shut their shops, while some sold their assets to a number of large developers. Our analysis has revealed that top 8 cities (Mumbai metropolitan region, National capital region, Bengaluru, Pune, Hyderabad, Ahmedabad, Chennai and Kolkata) accounted for more than 80% of the entire real estate business in the country in 2018.
Borrowing:
Developers largely depend on lending institutions when it comes to financing their construction activities. In the last decade, lending in the sector increased 3.33 times to Rs 4,00,000 crore from Rs 1,20,000 crore. At present, 55% of this amount is lent by NBFCs and housing finance companies, who have increased lending to the sector by 7.33 times. Back in 2009, they financed a mere 25% of the total debt.
Sales and income compared to debts
To get an idea of the amount of debt incurred by developers as compared to sales, we narrowed our focus on the developers in three parts of the country. And our observations are as follows:
| North | West | South | Total | |
| Number of developers | 20 | 34 | 36 | 90 |
| Cities covered | NCR | MMR & Pune | Bengaluru, Chennai, Hyderabad | |
| Revenue (Rs in cr) | 20833 | 33109 | 24886 | 78828 |
| Rental revenue (Rs in cr) | 1134 | 2938 | 3715 | 7787 |
| Operating Income | 4177 | 6621 | 4978 | 15776 |
| Debt (Rs in cr) | 40591 | 74503 | 30410 | 145504 |
| Disposable Income (operating income + rent) | 5312 | 9559 | 8693 | 23564 |
| (Rs in cr) | ||||
| Revenue/debt (times) | 0.5 | 0.4 | 0.8 | 0.5 |
As depicted in the table above, given the gross mismatch between a disposable income of Rs 23,564 crore and a yearly payment of Rs 45,128 crore of debt (considering 4-year loan repayment @11% p.a of total debt Rs 145,504 crore), it seems unlikely for these developers to service the debt in the current scenario.
To turn the tide, developers will now need to increase their operating income by 1.92 times. Further, they will have to increase operating income by at least 2 times to make a reasonable profit of 15%.
An evaluation of the entire sector gives us the following results:
| Number of developers | 11000 |
| Revenue (Rs in cr) | 240000 |
| Rental Revenue (Rs in cr) | 9000 |
| Operating income (Rs in cr) | 48000 |
| Disposable Income (operating income + rent) (Rs in cr) | 57000 |
| Debt (Rs in cr) | 400000 |
| Revenue/Debt | 0.6 |
According to our analysis, the total disposable income of the entire sector now stands at approximately Rs 57,000 crore as against repayment of Rs 1,28,772 crore (considering 4-year loan repayment @11% p.a of total debt Rs 2,40,000 crore). It signifies that disposable income of the sector will need to increase by at least 2.26 times. In addition, to make a profit of 15%, developers will need to increase income by 2.6 times.
In such a scenario, sales will need to increase by more than 2.6 times on the back of a long overdue price correction. However, is the correction possible? Here we are citing an example of Mumbai Metropolitan Region, wherein it will be almost impossible for developers to reduce prices without hurting their margins significantly.
| Kandivali (Mumbai) | 2005 | 2007 | 2009 | 2012 | 2015 | 2018 |
| Kandivali Project Price (Rs/psf) | 2700 | 6700 | 5100 | 10300 | 11600 | 11820 |
| Finance Cost (Rs/psf) | 446 | 950 | 1155 | 2699 | 3737 | 3838 |
| Land Cost @ Saleable Area (Rs/psf) | 300 | 1500 | 1000 | 2300 | 2800 | 2800 |
| Approval Cost (Rs/psf) | 216 | 670 | 612 | 1442 | 1624 | 1655 |
| Construction Cost (Rs/psf) | 1000 | 1100 | 1200 | 1300 | 1600 | 1800 |
| Construction and Gestation (yrs) | 3 | 4 | 4 | 5 | 6 | 6 |
| Project Cost (Rs/psf) | 1962 | 4220 | 3967 | 7741 | 9761 | 10093 |
| Developers Profit (Rs/psf) | 738 | 2480 | 1133 | 2559 | 1839 | 1727 |
| Profit Margin (%) | 0.27 | 0.37 | 0.22 | 0.25 | 0.16 | 0.15 |
Conclusion:
The liquidity crisis in this sector is mainly due to these two reasons. While lending went up, a large number of developers entered the market with additional borrowings and without any increase in sales, which led to a huge pile-up of inventory. Hence, they are now finding it difficult to clear their dues. The IL&FS defaults and downgrade of DHFL have further worsened the situation.
Disclosure: The above article is based on a report by Liases Foras
Ask Value Research 

 New episodes every Friday



 New Process Alert
 Seems like you've uploaded a wrong QR code. Please upload the QR code downloaded from MF Central platform.


