





Since 2014, the number of listed large caps has seen a marked rise, from 67 to 102. This number fluctuated in the period 1999-2013, dipping to as low as 54 in 2009 and touching the high of 79 in 2001. What has caused this rise in the number of listed large caps? If you thought, it is the bull market that started in 2014, sorry, that isn't the right reason.
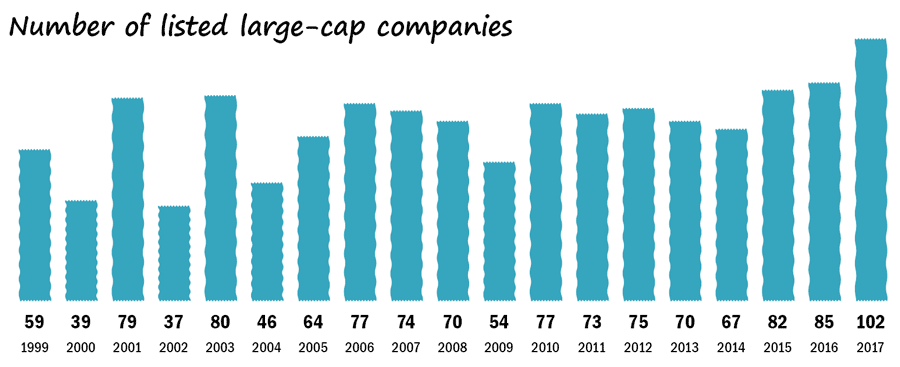
At Value Research, we have a dynamic method of determining market cap. The companies that comprise the top 70 per cent of the total market cap are termed as large caps. Those that comprise the next 20 per cent are tagged mid caps. And those that comprise the final 10 per cent are categorised under small caps. This means that market conditions alone themselves don't determine the market cap as cut-offs simply shift upward or downward in bull or bear markets.
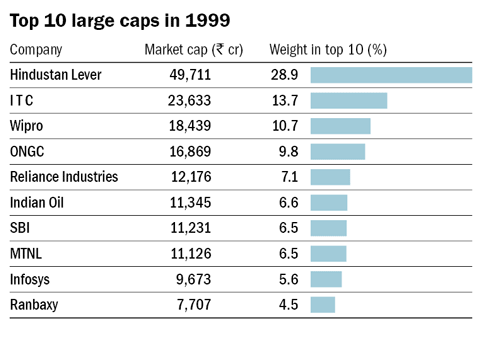
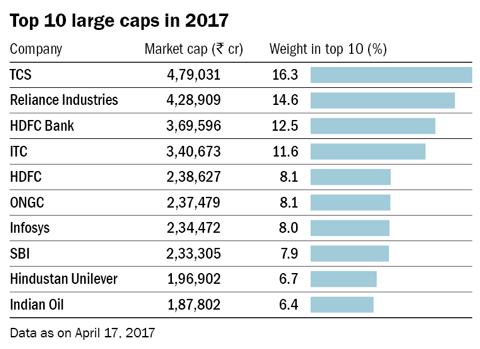
The increase in the number of listed large caps can be attributed to the reduction in dominance of a few companies in the Indian market. The tables mention the top ten large caps in 1999 and 2017. The distribution of weights of the top ten listed companies (as per cent of the total market cap of the top ten listed companies) has become more uniform over time. While in 1999, Hindustan Lever alone accounted for about 30 per cent of the total market cap of the top ten listed companies, now TCS makes up about 16 per cent. This indicates reducing concentration in the Indian market.
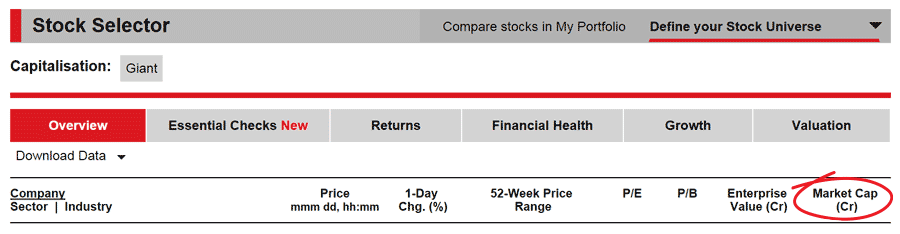
You can use our Stock Selector tool to find out the full list of all the listed large cap stocks in India. Once you open the tool, click on 'Define your Stock Universe', then click on 'Filter by Capitalisation' and then choose 'Giant' and 'Large Cap' in turns. Once the list is opened, you can sort it further by clicking on 'Market Cap'
Ask Value Research 
 New episodes every Friday


 New Process Alert
  Seems like you've uploaded a wrong QR code. Please upload the QR code downloaded from MF Central platform.


