



A popular tenet of stock investing is to stay away from overheated markets as they are vulnerable to corrections. But how do you know if the market is really overvalued? Instead of looking for tips from some talking heads, you can take a look at some historical data and find out the relationship between them to make your buy and sell decisions with better conviction. In fact, most market pundits like Buffett have their own favourite ratios.
We have highlighted some important parameters which will help you get an idea of market valuations. We have used the S&P BSE Sensex as the market indicator. The aggregate picture suggests that while the market has gone up significantly, it is still away from its historical highs across various parameters.
Does it mean that you rush and buy stocks? No. Combine these indicators with thorough research on companies before you take the buy call.
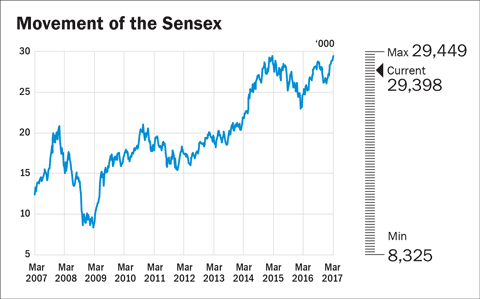
The Sensex is the most convenient indicator to tell the state of the market. Since 2014, with the coming of the NDA government, the Sensex has been on the rise. Sure there have been hiccups in between, but the upward trend has remained intact. Lately, after a brief fall in the market post demonetisation, the market has again resumed its upward journey.
While it's easy to track the Sensex, it should not be seen in isolation. The following metrics are better indicators of the expensiveness of the market.
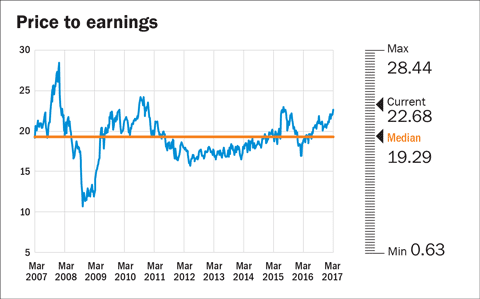
The price-to-earnings ratio of the Sensex is a simple market-valuation ratio. A general guideline to help understand the valuation is:
P/E > 24 = Dangerously overvalued
P/E > 20 < 24 = Overvalued
P/E > 16 < 20 = Fairly valued
P/E > 12 < 16 = Undervalued
P/E < 12 = Highly undervalued (mouthwatering valuations)
Currently, the Sensex P/E stands at 22.68.
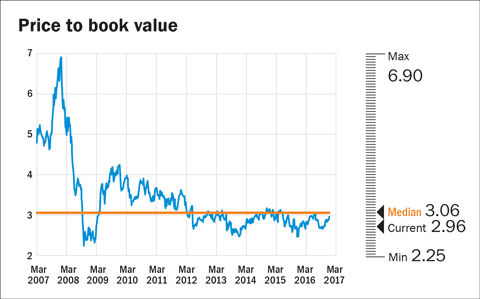
Price to book value tells us how many times an investor is ready to pay for a rupee of net assets.
Since book value is stable and less volatile than earnings, some consider it better than the P/E as a measure of valuation. If
P/BV > Average P/BV = Overvalued
P/BV < Average P/BV = Undervalued
Currently, P/BV stands at 2.96, way below its historical average.
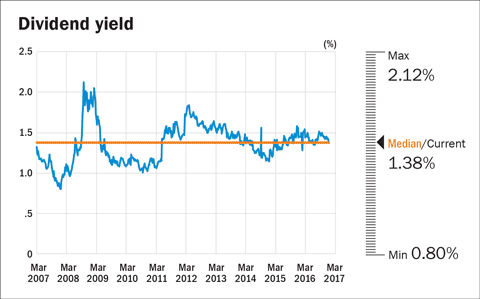
Dividend yield is nothing but the return an investor gets in the form of dividend on his investment. It is measured as dividend per share divided by price per share.
Generally speaking, when stocks are cheap, dividend yields are high. If
Dividend yield > Historic dividend yield = Undervalued
Dividend yield < Historic dividend yield = Overvalued
Currently, dividend yield is at 1.38 per cent.
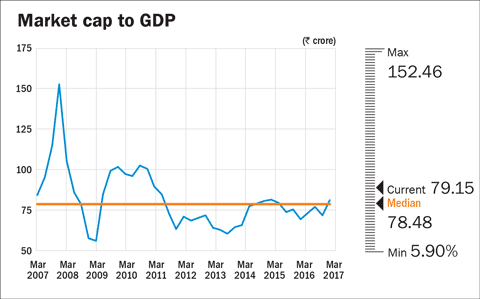
This measure is Buffett's personal favourite. He said, 'It is probably the single best measure of where valuations stand at any given moment.'
Here we have considered the market capitalisation of all the listed companies on the BSE. If
Market cap > GDP = Market overvalued
Market cap < GDP = Market undervalued
Currently, the market cap to GDP?stands at 79.15 per cent.
Data as on March 15, 2017
Sources : Thomson Reuters, BSE
This column appeared in the April 2017 Issue of Wealth Insight.
Ask Value Research 

 New episodes every Friday


 New Process Alert
 Seems like you've uploaded a wrong QR code. Please upload the QR code downloaded from MF Central platform.


