 Aditya Roy/AI-Generated Image
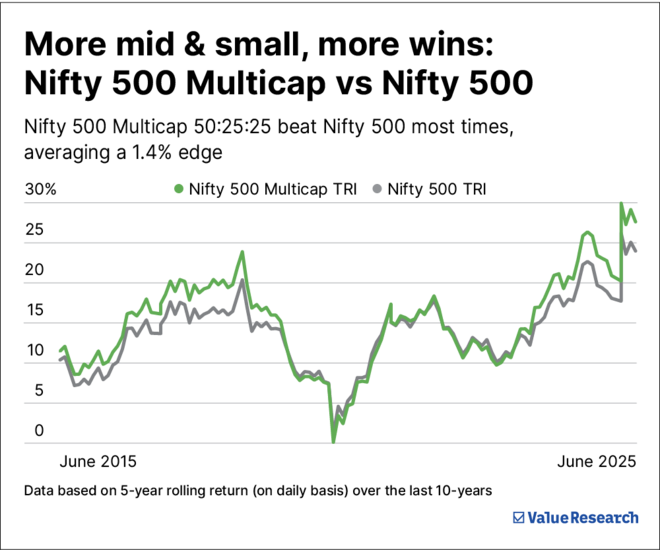
Two similar-looking indices. One small tweak. A decade of surprisingly different outcomes.
What if someone told you that two indices with the exact same 500 stocks could look and behave very differently?
That’s exactly what happens when you pit the Nifty 500 against the Nifty 500 Multicap 50:25:25.
Both tap into India’s top 500 companies. But while the former is more reliant on large caps, the latter ensures mid and small-caps always have a place at the table.
So, does this rule-based rebalancing make the multi-cap index a smarter choice? Let’s find out.
Same stocks, different recipe
Both indices draw from the same universe of India’s 500 largest listed companies, but differ sharply in how they spread the weight.
With Nifty 500, there’s no rule on how many should be large, mid or small companies. So, recently, it’s been about 75 per cent large-caps, 17 per cent mid-caps and only 8 per cent small-caps.
But the Nifty 500 Multicap 50:25:25 works differently. It fixes the mix: always 50 per cent large-caps, 25 per cent mid-caps, and the remaining 25 per cent small-caps.
Given how both indices are broadly structured, let’s now peek into the top five sectors for both indices to see if there is any big difference there.
Top 5 sector weightage (%) comparison
| Sector | Nifty Multicap | Nifty 500 |
|---|---|---|
| Financial Services | 28.38 | 31.25 |
| Capital Goods | 8.63 | 5.99 |
| Healthcare | 8.05 | 6.21 |
| Information Technology | 7.66 | 8.63 |
| Oil, Gas & Consumable Fuels | 6.24 | 7.84 |
| Data as of May 31, 2025 | ||
Both indices are huge fans of financial services, loading up heavily there, but the multicap spreads the affection a little more evenly across the board.
Also, the top 10 stocks are exactly the same in both indices, but how much space they take up is a different story. The Nifty 500 packs them tighter, with the top 10 making up 34 per cent of the index, while the multi-cap spreads things out more evenly, giving them a lighter 23 per cent share.
Do these differences actually pay off?
Time to see if all this tinkering with weights actually pays off.
Looking at five-year rolling returns over the past decade, the Nifty 500 Multicap outperformed the regular Nifty 500 a solid 70 per cent of the time, with an average edge of 1.4 percentage points. That’s a meaningful lead to rack up over long stretches. This outperformance can be captured in the graph below also.
Why is there a gap in returns? Simple — the multi-cap index holds more mid- and small-cap stocks, and these have done better over time. In the past 10 years (using 5-year rolling returns):
- Nifty 100 TRI gave around 13.3 per cent returns
- Nifty Midcap 150 TRI delivered around 18.3 per cent
- Nifty Smallcap 250 TRI grew 15.6 per cent
So, because the multi-cap index has more of the faster-growing mid and small companies, its returns have been higher.
Riding highs and weathering lows
Good long-term returns rarely come easily, especially if a portfolio has a sizable mid- and small-cap presence. They demand patience through multiple cycles of ups and downs. To see how these two indices held up in different market moods, we broke the period from 2010 to now into distinct rising and falling phases.
The tables below reveal how each index performed during bullish and bearish phases.
Return comparison during rising markets
| Period | Nifty Multicap TRI (%) | Nifty 500 TRI (%) |
|---|---|---|
| Jan 2010 – Nov 2010 | 26.9 | 21.2 |
| Dec 2011 – Mar 2015 | 30 | 27 |
| Feb 2016 – Jan 2020 | 15.5 | 16.6 |
| Mar 2020 – Oct 2021 | 93.1 | 83.2 |
| Jun 2022 – Sep 2024 | 37.7 | 33.4 |
| Returns are annualised for periods over one year and shown as absolute for periods under one year. Rising phases are defined as periods when the Nifty 50 TRI climbed from a bottom to its next peak | ||
The multi-cap index outperformed in 4 out of 5 bull phases, boasting an average lead of 5.7 percentage points over the Nifty 500. Clearly, that extra muscle from mid and small-caps comes alive when markets are on the rise.
Do they also fall more? Let’s explore.
Return comparison during declining markets
| Period | Nifty Multicap TRI (%) | Nifty 500 TRI (%) |
|---|---|---|
| Nov 2010 – Dec 2011 | -30.4 | -28.1 |
| Mar 2015 – Feb 2016 | -18.9 | -20.1 |
| Jan 2020 – Mar 2020 | -38.3 | -37.8 |
| Oct 2021 – Jun 2022 | -18.4 | -17.5 |
| Sep 2024 – Mar 2025 | -19.6 | -18.4 |
| Returns are annualised for periods over one year and shown as absolute for periods under one year. Declining phases are periods when the Nifty 50 TRI fell by 15 per cent or more. | ||
The multi-cap index did slip more in 4 out of 5 downturns, but the average lag was just 1.2 percentage points — a relatively modest setback. All things considered, that seems like a small price to pay for the extra lift it delivers when markets head north.
A word of caution: Backtest vs Reality
While the numbers look great, remember: the Nifty 500 Multicap 50:25:25 index was launched only in December 2020. All performance prior to that is based on backtested data — historical simulations, not real-world execution.
And in real life, index funds tracking this index may face liquidity constraints, higher impact costs and expense ratios that could eat into returns. So while the index story is compelling, actual fund performance may vary.
Verdict: Who should choose what?
If you're looking for broad market exposure but feel the Nifty 500 plays it too safe with large-caps, the multi-cap index offers a more aggressive, yet balanced, alternative. It forces you to stay invested in India’s full market spectrum — large, mid and small — in a disciplined, rule-based way.
Yes, it can sting a little bit more in downturns, but it more than makes up for it in good times.
So, for index investors who want to go beyond the usual suspects, the Nifty 500 Multicap 50:25:25 might just be the passive play with a little extra punch.
An investor education and awareness initiative of Nippon India Mutual Fund.
Helpful Information for Mutual Fund Investors: All Mutual Fund investors have to go through a one-time KYC (know your Customer) process. Investors should deal only with registered mutual funds, to be verified on SEBI website under 'Intermediaries/Market Infrastructure Institutions'. For redressal of your complaints, you may please visit www.scores.gov.in. For more info on KYC, change in various details and redressal of complaints, visit mf.nipponindiaim.com/InvestorEducation/what-to-know-when-investing.
Mutual fund investments are subject to market risks, read all scheme related documents carefully.
Also read: Nifty 100 is good, but there might be a smarter option
This article was originally published on July 02, 2025.
Ask Value Research ![]()