





When you buy a stock, you pay attention to the financials, debts, management, and competitive advantage of the business. But do you pay equal heed to the shareholding pattern of the business? The shareholding pattern of a business provides you with a better idea of other investors in the business and their activities.
Besides, you will learn about the detailed ownership of a business by studying this pattern. Hence, a consolidated picture of the shareholding patterns of different businesses goes a long way in revealing which investor group dominates the market.
While analysing the shareholding patterns of all BSE-listed companies over the past ten years, we have observed tectonic shifts in it. In addition to time, factors such as strict shareholding regulations and the privatisation of certain sectors like defence, retail and insurance (FDI) contributed significantly to these shifts.
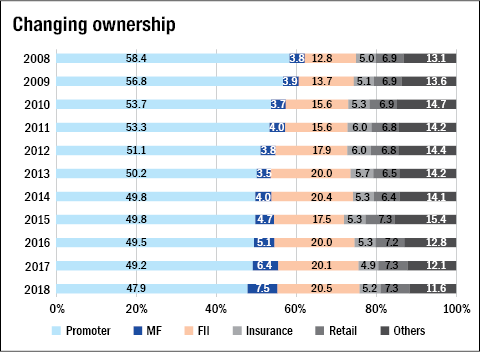
Here is how the ownership has changed in terms of market capitalisation.

Further, we have made a few observations, which are as follows:
Observation 1
A decade ago, promoters used to be the dominant force in the Indian market. However, they have now started losing their stake to institutions and mutual funds. Decreasing promoters' stake has resulted in an increase in liquidity and accountability of promoters towards their investors. Besides, it has provided the liquidity required for widening the investor base.
The following chart illustrates a gradual shift from promoters holdings to institutions over the past 10 years.
Observation 2
The rise of Mutual Funds
Since December 2013 (during the Modi government), the Indian market has witnessed a significant increase in Mutual fund investments. This can be attributed to the increasing awareness of SIP, lower FD rates, underperformance of other asset classes and a stable political scenario. Indian retail investors are now driving the markets by indirectly investing through mutual funds, whereas the direct investments of retail investors have fallen slightly as compared to 2008 (7.3 per cent versus 6.9 per cent). The current ratio of FII investments to Mutual Fund investments also stands at a 10-year low of 3.3 times.
Astonishingly, mutual funds-which hardly had the ability to influence the market a decade back-are now giving a tough competition to foreign investors.
- FII investments - Rs 25.5 lakh crore (20.5 per cent of total market cap)
- MF investments - Rs 9.5 lakh crore. (7.5 per cent of total market cap)
- FII 5 year CAGR investment increase (%): 15.2
- MF 5 year CAGR investment increase (%): 33.5
The following chart elucidates the rising influence of mutual funds as compared to FII investments.
The Ratio of FII Investments versus Mutual Fund investments

The free-float donut
Going a step ahead, we have also analysed the shift in the shareholding pattern on a free float basis (free float excludes the promoters' stake or it can also be said as non-promoter shareholding). It helped us observe the changing trend in the shareholding of institutions and retail investors over the years.

* Data as of December, 2018
** Others include banks, government holdings, NBFC`s, alternate investment funds, provident funds, NRI`s, employees, employee trusts/other trusts, HNI investors, escrow account and domestic/foreign corporate bodies
Ask Value Research 

 New episodes every Friday


 New Process Alert
  Seems like you've uploaded a wrong QR code. Please upload the QR code downloaded from MF Central platform.


