


Indian Energy Exchange Ltd.
NSE: IEX | BSE: 540750
₹124.43
As on 21-Jul-2026IST
Market cap
₹11,119 Cr
Revenue (TTM)
₹616 Cr
P/E Ratio
22.6
P/B Ratio
8.1
Div. Yield
2.8 %
Quality Score ![]()
![]() 10/10
10/10
Growth Score ![]()
![]() 7/10
7/10
Valuation Score ![]()
![]() 6/10
6/10
Momentum Score ![]()
![]() 3/10
3/10
Stock Range
Today’s Range
52 Week Range
Liquidity![]()
Fundamentals
-
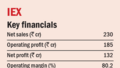
Net Profit (TTM)

₹493 Cr
-
ROE
41.4 %
-
ROCE
53.8 %
-
Industry P/E
52.32
-
EV/EBITDA
16.9
-
Debt to Equity
0
-
Book Value
₹15.3
-
EPS
₹5.5
-
Face value
1
-
Shares outstanding
891,692,735
10 Years Aggregate
CFO
₹2,461.74 Cr
EBITDA
₹2,639.67 Cr
Net Profit
₹2,286.06 Cr
Performance
|
Company
|
YTD
|
1 Month
|
3 Months
|
1 Year
|
3 Years
|
5 Years
|
10 Years
|
|---|---|---|---|---|---|---|---|
|
IEX
| -7.3 | 1.3 | -0.4 | -38.7 | 0.1 | -2.7 | -- |
|
BSE Finance
| -3.3 | 1.3 | 1.8 | -0.1 | 8.9 | 10.5 | 11.6 |
|
Company
|
2025
|
2024
|
2023
|
2022
|
2021
|
2020
|
2019
|
|---|---|---|---|---|---|---|---|
|
IEX
| -25.5 | 8.2 | 20.0 | -44.6 | 244.4 | 59.3 | -14.1 |
|
BSE Small Cap
| -6.6 | 29.0 | 47.5 | -1.8 | 62.8 | 32.1 | -6.8 |
|
BSE Finance
| 15.7 | 8.7 | 17.1 | 11.1 | 14.1 | 0.8 | 18.0 |
Essential Checks
View DetailsIs there a threat to the company's solvency?
Can creative accounting be detected through the financial numbers?
How did the company perform in the last one year?
Financials
View DetailsKey Ratios
View Details
5Y Avg -- 3Y Avg -- TTM --
P/E Ratio
--
--Min --Median --Max
P/B Ratio
--
--Min --Median --Max
Earnings Yield (%)
--
Earnings Yield (%) = EBIT / Enterprise value
PEG Ratio
--
Price = Price / Earnings to growth ratio
Peers
View DetailsCompany |
Price (₹) | Market Cap (₹ Cr) | Revenue (TTM) | Net Profit (TTM) | OPM (%) | ROE (%) | P/E | P/B |
|---|---|---|---|---|---|---|---|---|
|
IEX
|
124.4 | 11,119.4 | 615.7 | 473.1 | 80.7 | 37.7 | 22.6 | 8.1 |
| 321.9 | 29,461.0 | 5,425.8 | 1,032.2 | 35.0 | 17.3 | 28.5 | 4.8 | |
| 3,664.0 | 1,49,448.7 | 4,834.4 | 2,421.8 | 60.4 | 34.7 | 59.9 | 22.4 | |
| 767.3 | 19,032.3 | 1,516.3 | 472.0 | 38.6 | 40.2 | 40 | 14.9 | |
| 1,364.9 | 28,526.4 | 1,144.9 | 455.1 | 45.4 | 24.5 | 62.5 | 14.6 | |
| 6.9 | 2.8 | 0.0 | -0.2 | -- | -- | -- | -31.1 | |
| 816.9 | 18,160.7 | 1,118.4 | 237.9 | 33.9 | 15.9 | 83.4 | 11.1 | |
| 6.5 | 159.7 | 44.8 | 5.6 | 8.5 | 2 | 36.8 | 0.5 | |
| 888.9 | 15,372.1 | 1,301.5 | 343.7 | 34.1 | 22.7 | 44.7 | 9.4 | |
| 2,801.2 | 71,515.0 | 2,302.0 | 1,336.5 | 68.1 | 36.3 | 53.7 | 25.1 |
Shareholding Pattern
View DetailsNews & Analysis
All News
IEX CFO: Gearing up for the big reforms
4 min read•By Value Research


Stocks with increasing mutual fund stake
3 min read•By Danish Khanna

The Backing of a Resilient Balance Sheet
5 min read•By Jugal Harpalani
2 min read•By Research Desk
IEX IPO - Information Analysis
6 min read•By Prasoon Vijay
About IEX
Indian Energy Exchange Limited provides automated trading platform for physical delivery of electricity, renewable energy, and certificates. The company offers Day-Ahead Market, a physical electricity trading market which allows market participants... to buy and sell electricity for the next day; Term-Ahead-Market that provides a range of products allowing participants to buy and sell electricity on intra-day, day-ahead contingency, and term ahead contracts; Real-Time Market, an auction session every half an hour with power to be delivered after 4 time blocks or an hour after gate closure of the auction; Green Day-Ahead Market that allows market participants to buy and sell renewable electricity for the next day; Cross-Border Electricity Trade expands the Indian power market towards building an integrated South Asian power market; High Price Day Ahead Market, a part of integrated day ahead market allows market participants to buy and sell electricity for the next day to be traded are determined through a double-sided closed auction bidding process; and Green-Term Ahead Market, a market solution for renewable energy trading which features contracts, including Green-Intraday, Green-Day-ahead Contingency, Green-Daily, and Green-Weekly. It also provides renewable energy and energy saving certificates. The company was incorporated in 2007 and is based in Noida, India. Read more
-
Incorporated
2007
-
Chairman
Satyanarayan Goel
-
Managing Director
Satyanarayan Goel
-
Headquarters
New Delhi, Delhi
-
Website
Looking for more details about Indian Energy Exchange Ltd.’s IPO? Explore our IPO Details page.
Value Research Ratings
Our rating system has guided millions of investors in the past 20 years.
Quarterly Updates
Annual Reports
FAQs for IEX
What is the current share price of Indian Energy Exchange Ltd Today?
The share price of Indian Energy Exchange Ltd is ₹124.43 (NSE) and ₹124.40 (BSE) as of 21-Jul-2026 IST. Indian Energy Exchange Ltd has given a return of 0.09% in the last 3 years.
What is the current PB & PE ratio of Indian Energy Exchange Ltd?
The P/E ratio of Indian Energy Exchange Ltd is 22.56 times as on 21-Jul-2026, a 57 discount to its peers’ median range of 52.32 times.
The P/B ratio of Indian Energy Exchange Ltd is 8.15 times as on 21-Jul-2026, a 34 discount to its peers’ median range of 12.28 times.
PE & PB ratio at the end of financial year.
| Year | P/E Ratio | P/B Ratio |
|---|---|---|
|
2025
|
36.46
|
13.99
|
|
2024
|
34.11
|
12.52
|
|
2023
|
37.25
|
14.55
|
|
2022
|
65.16
|
29.24
|
|
2021
|
16.07
|
19.31
|
What is the 52 Week High and Low of Indian Energy Exchange Ltd?
The 52-week high and low of Indian Energy Exchange Ltd are Rs 205.00 and Rs 114.60 as of 21-Jul-2026.
What is the market cap of Indian Energy Exchange Ltd?
Indian Energy Exchange Ltd has a market capitalisation of ₹ 11,119 Cr as on 21-Jul-2026. As per SEBI classification, it is a Small Cap company.
Should I invest in Indian Energy Exchange Ltd?
Before investing in Indian Energy Exchange Ltd, assess your goals, risk tolerance, and if the company aligns with your long-term plan. Carefully review its business model, financials, and valuation. Avoid making decisions based on tips or short-term trends.