In a nutshell
-
Quality
: Pyramid Technoplast's three-year average
ROE
and ROCE are 33.1 and 21.3 per cent, respectively.
-
Growth
: Its revenue and net profit grew 23.7 and 36.7 per cent per annum, respectively between FY21 and FY23.
-
Valuation
: The stock will trade at a
P/E
and P/B of 19.2 and 3.1, respectively, which is lower than its peers' median P/E and average P/B, respectively.
- Overview : The growth in India's manufacturing sector has fuelled the growth of the packaging industry. Consequently, the company has experienced consistent growth over the years. However, changes in regulatory requirements and slowdown in the manufacturing sector can dampen the momentum of the company.
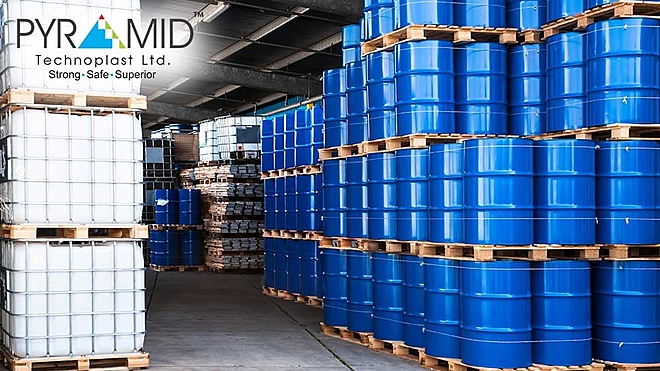
About Pyramid Technoplast
Pyramid Technoplast is an industrial packaging company incorporated in 1997. It operates a total of six manufacturing units and produces polymer-based moulded products used by chemical, agrochemical, specialty chemical and pharmaceutical companies. It generates the majority of its revenue from polymer drums (a three-year average contribution of about 54 per cent), followed by rigid intermediate bulk containers or IBC (30 per cent), milled steel drums (10 per cent) and the remaining from sale of scraps and raw materials.
Strengths of Pyramid Technoplast
- Enjoys long-term relationships with most of its clients . In each of the last three years, it has received repeat business from more than 376 customers.
- The strategic location of manufacturing units in Gujarat and the union territory of Dadra allows the company to operate in production hubs.
Weaknesses of Pyramid Technoplast
- Changes in the regulatory environment or quality norms set by the client or government can be highly detrimental to the company's business environment.
- Pyramid Technoplast has high receivables. Trade receivables as a percentage of total assets averaged 39 per cent over FY21-23.
IPO details
| Total IPO size (₹ cr) | 153 |
| Offer for sale (₹ cr) | 62 |
| Fresh issue (₹ cr) | 91 |
| Price band (₹) | 151-166 |
| Subscription dates | August 18, 21 and 22, 2023 |
| Purpose of issue | To repay debt and fund working capital |
Post-IPO
| M-cap (₹ cr) | 611 |
| Net worth (₹ cr) | 199 |
| Promoter holding (%) | 75 |
| Price/earnings ratio (P/E) | 19.2 |
| Price/book ratio (P/B) | 3.1 |
Financial history
| Key financials | 2Y growth (% pa) | FY23 | FY22 | FY21 |
|---|---|---|---|---|
| Revenue (₹ cr) | 23.7 | 480 | 400 | 314 |
| EBIT (₹ cr) | 32.9 | 45 | 38 | 25 |
| PAT (₹ cr) | 36.7 | 32 | 26 | 17 |
| Net worth (₹ cr) | 107 | 75 | 49 | |
| Total debt (₹ cr) | 55 | 65 | 51 | |
| PAT is profit after tax | ||||
Key ratios
| Ratios | 3Y average (%) | FY23 | FY22 | FY21 |
|---|---|---|---|---|
| ROE (%) | 33.1 | 29.6 | 34.8 | 34.8 |
| ROCE (%) | 21.3 | 21.4 | 21.4 | 21.1 |
| EBIT margin (%) | 9 | 9.4 | 9.4 | 8.1 |
| Debt-to-equity | 0.5 | 0.9 | 1.1 | |
|
ROE is return on equity ROCE is return on capital employed EBIT is earnings before interest and taxes |
||||
Risk report of Pyramid Technoplast
Company and business
-
Are Pyramid Technoplast's earnings before tax more than Rs 50 crore in the last 12 months?
No, the company's profit before tax for FY23 was Rs 43 crore. -
Will Pyramid Technoplast be able to scale up its business?
Yes, growth in the chemical and pharmaceutical industries will directly impact the demand for its packaging products. -
Does Pyramid Technoplast have recognisable brands with client stickiness?
No, the company operates in a highly competitive industry and does not have a recognisable brand. -
Does the company have a credible moat?
No, the company faces high competition in the industry.
Management
-
Do any of Pyramid Technoplast's founders still hold at least a 5 per cent stake in the company? Or do promoters hold more than a 25 per cent stake in the company?
Yes, the promoter's stake will be 75 per cent post-IPO. -
Do the top three managers have more than 15 years of combined leadership at Pyramid Technoplast?
Yes, the Managing Director and the CFO have a cumulative experience of over 40 years with the company. -
Is the management trustworthy? Is it transparent in its disclosures, which are consistent with SEBI guidelines?
Yes, no information to suggest otherwise. -
Is the company's accounting policy stable?
Yes, no information to suggest otherwise. -
Is Pyramid Technoplast free of promoter pledging of its shares?
Yes, there is no pledging from the promoters.
Financials
-
Did the company generate a current and three-year average return on equity of more than 15 per cent and a return on capital employed of more than 18 per cent?
Yes, the company's three-year average ROE and ROCE are 33.1 and 21.3 per cent, respectively. In FY23, the company's ROE and ROCE were 29.6 and 21.4 per cent, respectively. -
Was the company's operating cash flow positive during the last three years?
No, the cash flow from operations was negative (a negative Rs 6 crore) in FY22. -
Is the company's net debt-to-equity ratio less than one?
Yes, the net debt-to-equity ratio was 0.5 for FY23. -
Is Pyramid Technoplast free from reliance on huge working capital for day-to-day affairs?
No, the company has high working capital requirements. -
Can the company run its business without relying on external funding in the next three years?
Yes, the company has a net debt-to-equity ratio of less than one and post the proceeds from the current issue, it should not require external funding. -
Is Pyramid Technoplast free from meaningful contingent liabilities?
Yes, contingent liabilities as a percentage of equity is 1.3 per cent.
Valuations
-
Does the stock offer an operating earnings yield of more than 8 per cent on its enterprise value?
No, the stock will offer an operating earnings yield of 6.8 per cent. -
Is the stock's price-to-earnings less than its peers' median level?
Yes, the stock will trade at a price-to-earnings ratio of 19.2 which is lower than the peers' median level of 22.7 times. -
Is the stock's price-to-book value less than its peers' average level?
Yes, the stock will trade at a price-to-book ratio of 3.07 which is marginally lower than the peers' average level of 3.18 times.
Disclaimer: This is not a stock recommendation. Do your due diligence before investing.
Suggested read: What to look for in a company before investing
Ask Value Research ![]()