 AI-generated image
Sectoral and thematic funds have been an investor favourite since 2024. These funds raked in a staggering Rs 1.83 lakh crore in net inflows-nearly 30 per cent of all net inflows across categories - on the back of very strong performance. But here's the twist: while the numbers on paper look spectacular, the returns investors earn tell a different story.
Let's dive into the data to understand why this happens.
Sectoral & Thematic Funds: The front-runners of most market rallies
Bull runs always have their favourites and more often than not, sectoral/thematic funds dominate the leaderboard. The recent rally from June 2022 is no exception. Leading the charge this time are PSU and Infrastructure funds, with PSU funds surging 174 per cent and Infrastructure funds soaring 147 per cent during this period.
This isn't an isolated trend. Looking at past bull phases since the 2007-08 crisis, at least two of the top five performing categories of mutual funds have consistently belonged to the sectoral/thematic segment.
Every market party has its sectoral/thematic VIPs
Since the 2008 crisis, every bull run has seen 2 or 3 sectoral/thematic categories in the top five
| Bull phases | Top 5 mutual fund categories |
|---|---|
| Mar-2009 to Nov-2010 | Banking (152%), Mid-cap (102%), Technology (99%), Small-cap (96%), Value-oriented (93%) |
| Dec-2011 to Jan-2015 | Small-cap (40%), MNC (39%), Mid-cap (38 %), Pharma (37%), Value-oriented (33%) |
| Feb-2016 to Jan-2020 | Banking (20%), ESG (16%), Consumption (15%), Energy (15%), Large-cap (15%) |
| Mar-2020 to Oct-2021 | Technology (120%), Small-cap (103%), Energy (96%), Mid-cap (87%), Infrastructure (84%) |
| Jun-2022 to Sep-2024 | PSU (56%), Infrastructure (46%), Small-cap (41%), Mid-cap (40%), Value-oriented (39%) |
| Note: Bullish phases are measured from market troughs to subsequent peaks. Highlighted funds belong to the sectoral/thematic category. | |
The table explains that the biggest drivers of wealth creation in bull rallies are sectors and themes (more often and not).
But let's see if investors actually see a reflection of these rallies in their portfolios.
Hot returns, lukewarm gains
Numbers suggest not. Although different sectoral and thematic categories have delivered strong returns over time, investors have not been able to soak in all these gains.
When we compared 10-year SIP (systematic investment plan) returns across 61 sectoral/thematic funds with the actual investor returns (calculated using inflow-adjusted internal rate of return to mimic real investor behaviour), the results revealed a significant gap:
The attempt of timing can cost you dearly
The investment gap between fund's return and investor's gain can be as high as 11 per cent
| Sectoral/thematic category | SIP return (%) | Investor return (%) | Return gap (%) |
|---|---|---|---|
| Banking | 11.0 | 8.1 | -2.9 |
| Technology | 20.0 | 14.6 | -5.4 |
| Dividend Yield | 16.4 | 9.3 | -7.1 |
| Consumption | 15.1 | 9.5 | -5.6 |
| Infrastructure | 17.6 | 6.4 | -11.2 |
| MNC | 10.1 | 6.4 | -3.7 |
| PSU | 18.1 | 8.4 | -9.7 |
| Energy | 16.6 | 13.9 | -2.7 |
| Pharma | 16.9 | 9.2 | -7.7 |
| ESG | 13.1 | 6.5 | -6.6 |
| Note: Based on 10-year SIPs of Rs 10,000 per month in regular plans | |||
Why this return gap
A major reason for this underperformance is recency bias. When a sector or theme delivers strong returns, investors rush in, eager to join the party. The problem? They often arrive late, after much of the rally has already played out. A deeper analysis reveals that while this trend is pervasive across sectors and themes, some sectors showcase this much clearly.
1. PSU
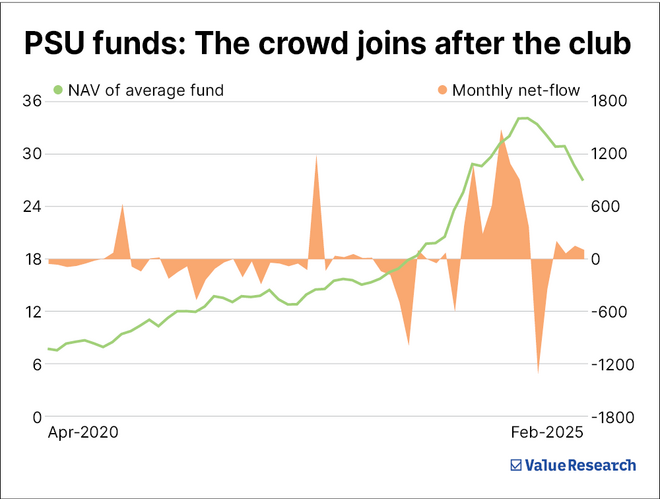
From April 2020 to January 2024, PSU funds gave an annualised return of 42 per cent (283 per cent absolute return). Yet, despite this massive rally, investors withdrew Rs 2,616 crore from the category.
Even more telling is the fact that once the rally slowed, inflows surged. From January 2024 to late September 2024, PSU funds saw net inflows of Rs 5,356 crore, but during this period, returns moderated to 29.6 per cent.
2. Infrastructure
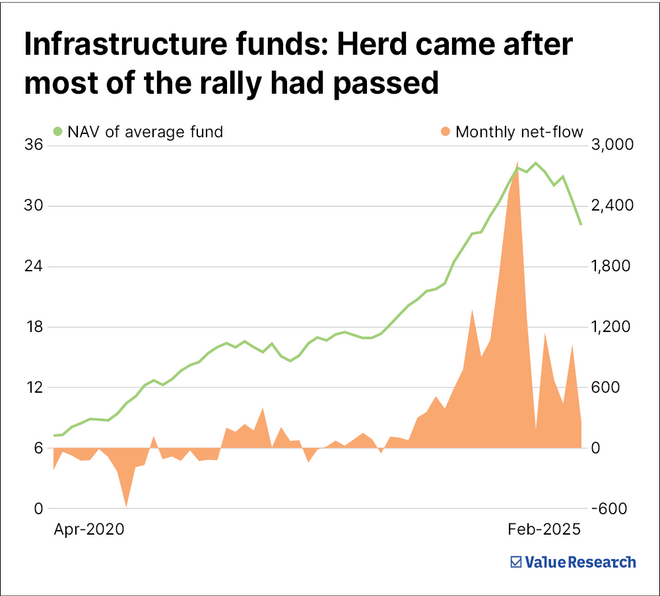
Between April 2020 and July 2023, infrastructure funds posted a 41 per cent annualized return (213 per cent absolute return), yet investors largely stayed away, withdrawing a net of Rs 405 crore.
Investor enthusiasm surged only after the rally had already matured. Between August 2023 and September 2024, net inflows soared to Rs 16,041 crore. Much of this money poured in during the later stages of the bull run. By September 2024, the markets had entered a correction phase, dragging this category down by around 24 per cent by early March 2025.
NFO launches in good times
In addition to recency bias, fund houses often capitalise on market euphoria, rolling out NFOs when the excitement is at its highest. As a result, many investors join the party late, only to watch the bubble burst and their returns take a hit. To see this in action, let's examine three market frenzies: the dot-com bubble of the early 2000s, the housing/infrastructure boom of 2004-08 and the defence enthusiasm of last year.
Tech Boom of the 2000s: NFOs flooded near the peak

From September 1998 (when the first tech fund was launched) to February 2000 (when the tech rally peaked), the category delivered a jaw-dropping 847 per cent return. No surprise, NFOs started flooding in. While three funds launched in the initial phase of the rally, collectively raising a modest Rs 23.48 crore, as the euphoria hit its peak, five more funds launched between January and April 2000, amassing a staggering Rs 1,592 crore. Then came the crash, and just like that, no new tech funds were launched for the next 15 years.
Infrastructure boom of 2004-08
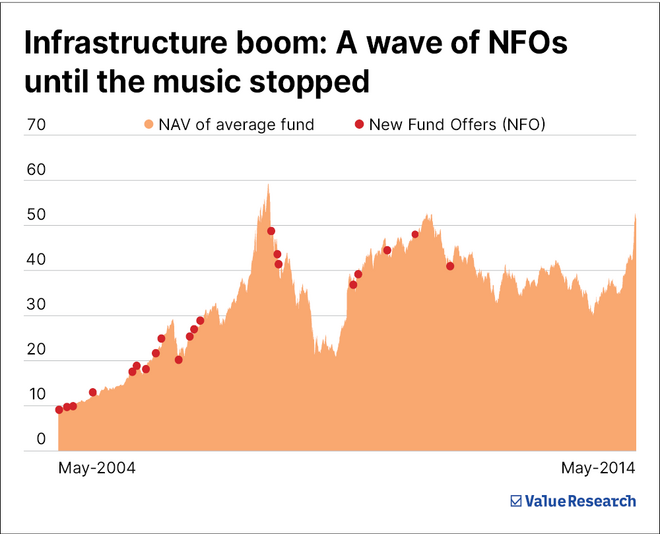
Infrastructure funds followed the same script. From 2004 to early 2008, NFOs kept pouring in, raising a total of Rs 9,121 crore. The first four NFOs, launched in 2004 before the rally took off, raised just Rs 1,414 crore (16 per cent of the total raised over five years). However, once the infrastructure bubble burst in 2008, investor enthusiasm disappeared. From 2009 to 2022, only five new infrastructure funds were launched-compared to 16 funds between 2004 and 2008.
Defence
A similar trend emerged in defence funds. The Nifty India Defence Index delivered a staggering 90 per cent annualised return from April 2020 until its peak on July 11, 2024. However, investor interest peaked after the rally. Of the six defence funds launched (including ETFs and FoFs), five debuted between June and October 2024, raising Rs 2,758 crore, just as the sector was nearing its peak.
This stark contrast highlights how fund launches align with investor sentiment at market highs, often setting them up for disappointment.
Quick takeaways
-
Timing is everything... but good luck getting it right!
- Picking the perfect entry and exit points sounds great in theory, but in reality, it's like trying to hit a moving target in the dark. Even pros struggle with it, so why risk it?
-
Chasing trends is like arriving at a party when the food's already gone
- Sectoral and thematic funds may look tempting after a big rally, but by the time most investors jump in, the best gains are often behind them. Your portfolio deserves better than leftovers!
-
Go for the boring but reliable route
- Instead of chasing the next big thing, stick to SIPs in well-diversified funds. They may not be flashy, but they'll help you avoid nasty surprises when a hot sector suddenly turns cold.
- And as this story goes online, the most recent AMFI data shows net inflows into this category dropped by a staggering 97 per cent in March to just Rs 170 crore, compared to Rs 5,712 crore in February, while net withdrawals were for over Rs 8,000 crore, which is 55 per cent more than the previous month. This reinforces our point that we as investors usually enter and exit sectoral and thematic funds in the worst possible moments.
Also read: All roads to wealth creation go through SIPs
This article was originally published on April 19, 2025.
Disclaimer: This content is for information only and should not be considered investment advice or a recommendation.
For grievances: [email protected]
Ask Value Research ![]()