 Aditya Roy/AI-Generated Image
Summary: A 40-kilometre waterway is dominating headlines and investor WhatsApp groups alike. Oil, geopolitics and AI fears are being woven into one anxious narrative. But is the real risk in the Strait or in our reactions to it? This piece explores the narrow gap between a headline and a costly investment decision.
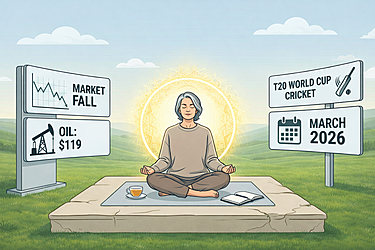
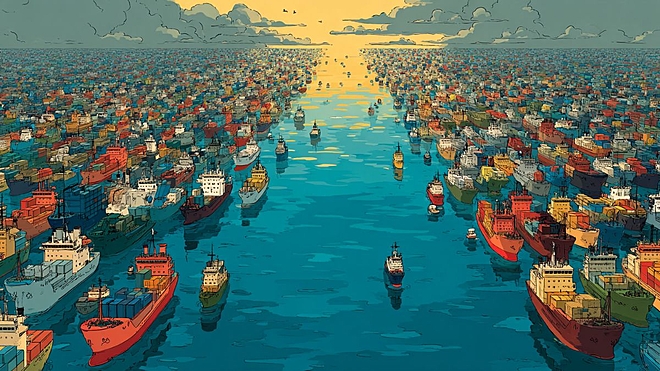
Right now, millions of Indians are staring at the same map. A narrow waterway between Iran and Oman, barely 40 kilometres wide at its chokepoint, through which roughly a fifth of the world’s oil passes every day. Television anchors are drawing arrows on it. WhatsApp groups are forwarding it with breathless commentary. And investors, some of whom have spent years building sensible, disciplined portfolios, are making decisions based on it. That makes it, for Indian investors at least, the most expensive map in the world. Not because of what it shows, but because of the decisions it provokes.
Let me be clear about what is real. India imports roughly 85 per cent of its energy needs. A sustained spike in oil prices will pressure aviation, transportation, and the current account. Every $10 per barrel increase in crude adds approximately $18 billion, or roughly Rs 1.65 lakh crore, to the annual import bill. To put that in perspective, the entire PM-Kisan scheme, which puts Rs 6,000 a year into the hands of 9.5 crore farmer families, costs the government Rs 63,500 crore. A $10 move in oil costs India more than twice that amount. These are not trivial numbers, and I am not going to pretend otherwise. If you are anxious about what a disruption at the Straits of Hormuz means for the Indian economy, your anxiety is not irrational.
But anxiety and action are different things, and the distance between them is where most investment mistakes are made. Consider what the risk at the Straits actually consists of. As Devina Mehra has pointed out in her analysis of the Iran conflict, the danger is not a physical blockade. No major party genuinely wants to stop oil from flowing. The real risk is insurance: whether anyone is willing to underwrite the risk of tankers moving through those waters. That could push oil prices higher temporarily, perhaps above $80, by spiking risk premiums. But without a prolonged physical blockage, the impact on global supply chains remains contained. India’s strategic petroleum reserves of 74 days, plus ethanol blending, provide a further buffer. The map shows geography. It does not show resilience, reserves, or the policy toolkit that governments have at their disposal.
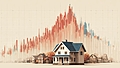
The map also has a way of shrinking your time horizon. It draws your eye to one waterway and one week. Data draws your eye elsewhere. Mehra’s team has studied 50 years of geopolitical conflicts, from the Gulf Wars to 9/11 to Russia-Ukraine, and the pattern is remarkably consistent. Markets sell off. Headlines escalate. And then, for every market except those directly in the conflict zone, recovery follows. During the first Gulf War in 1990, the Sensex fell 39 per cent over 15 weeks and recovered within nine months. After 9/11, Indian markets were back to pre-attack levels within 70 days. The Russia-Ukraine war in 2022 caused an initial shock, but the Nifty ended that calendar year higher than it began. Geopolitical shocks create volatility, not permanent value destruction. The investors who paid the highest price in every one of these episodes were the ones who acted on the map and forgot the spreadsheet.
There is, of course, a second map that most investors are not looking at: the one reshaping aggregate demand and economic structure beneath the geopolitical noise. The current crisis sits atop a deeper anxiety about AI displacement and economic disruption. This is where Manish Dangi’s thinking is useful to consider. Yes, AI will displace many jobs. That much is obvious. But to leap from displacement to aggregate demand destruction, as some commentators do, is to assume that policy action will remain entirely absent. It never does. Governments will ensure that tomorrow’s aggregate demand exceeds today’s: through rate cuts, fiscal transfers, effectively shipping paycheques to households. The real question is distributional, not aggregate. Demand for certain goods and services will fall as some workers lose high-income jobs, while demand elsewhere will rise, financed by policy. I wrote recently about the gap between what AI demos well in controlled environments and what it actually delivers when confronting the messy real world. That gap remains enormous. The panic, as always, runs well ahead of the reality.
Suggested read: The million bug reports that AI can’t match
Which brings me to the most dangerous chokepoint of all, and it is not between Iran and Oman. It is the narrow passage between a headline and a decision. I have written before about how pessimists sound smart and optimists make money. Today’s doom narrative is especially seductive because it braids geopolitics, AI disruption, and oil into a single cocktail of paralysis. It sounds sophisticated. It feels prudent. And it has been wrong, as a basis for long-term investment decisions, in every single historical parallel we have. Bearish voices grow loudest precisely when markets are falling; that is the exact moment when listening to them does the greatest damage.
Equity investment is, at its core, a bet on the future. The Indian economy will grow. Temporary setbacks, even painful ones, do not change the direction of travel. The investor who checks prices obsessively, spirals into worst-case predictions, and makes emotional decisions based on maps and headlines pays a cost far larger than any oil price spike. Your SIPs continue undisturbed. No profit booking; it has never made sense in funds. If your asset allocation was right last week, it is right today. For those with spare investable cash, a correction is an opportunity, not a threat. Diversification, including meaningful global allocation, provides structural resilience that no amount of map-staring can.
The Straits of Hormuz are 40 kilometres wide. The distance between a good investor and an ordinary one is far narrower. It is the space between a headline and the decision not to act on it. Put the map away. Open your investment plan.
Also read: Optimists live longer. They also invest better
Ask Value Research ![]()